Download
1 / 48
510 likes | 841 Views
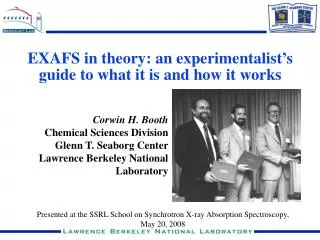
EXAFS in theory: an experimentalist’s guide to what it is and how it works. Corwin H. Booth Chemical Sciences Division Glenn T. Seaborg Center Lawrence Berkeley National Laboratory. Presented at the SSRL School on Synchrotron X-ray Absorption Spectroscopy, May 20, 2008. Topics. Overview

E N D
EXAFS in theory: an experimentalist’s guide to what it is and how it works Corwin H. Booth Chemical Sciences Division Glenn T. Seaborg Center Lawrence Berkeley National Laboratory Presented at the SSRL School on Synchrotron X-ray Absorption Spectroscopy, May 20, 2008
Topics • Overview • Theory • Simple “heuristic” derivation • A real derivation (just for show) • polarization: oriented vs spherically averaged • Experiment: Corrections and Other Problems • Dead time (won’t cover) • Self-absorption • Sample issues (size effect, thickness effect, glitches) (won’t cover) • Energy resolution (won’t cover) • Data Analysis • Fitting procedures (Wednesday) • Fourier concepts • Systematic errors • “Random” errors • F-tests
X-ray absorption spectroscopy (XAS) experimental setup double-crystal monochromator ionization detectors • sample absorption is given by • t = loge(I0/I1) • reference absorption is • REF t = loge(I1/I2) • NOTE: because we are always taking relative-change ratios, detector gains don’t matter! beam-stop I2 I1 I0 “white” x-rays from synchrotron LHe cryostat reference sample sample collimating slits
X-ray absorption spectroscopy continuum unoccupied states EF filled 3d 1s core hole • Main features are single-electron excitations. • Away from edges, energy dependence fits a power law: AE-3+BE-4 (Victoreen). • Threshold energies E0~Z2, absorption coefficient ~Z4. From McMaster Tables
X-ray absorption fine-structure (XAFS) spectroscopy e- :ℓ=±1 continuum unoccupied states ~E0 EF filled 3d pre-edge occupied states E0: photoelectron threshold energy 2p core hole EXAFS region: extended x-ray absorption fine-structure “edge region”: x-ray absorption near-edge structure (XANES) near-edge x-ray absorption fine-structure (NEXAFS)
U Pd “pre-edge” subtraction “post-edge” subtraction determine E0
How to read an XAFS spectrum 3.06 Å Real part of the complex transform Amplitude envelope [Re2+Im2]1/2 2.93 Å • Peak width depends on back-scattering amplitude F(k,r), the Fourier transform (FT) range, and the distribution width of g(r), a.k.a. the Debye-Waller s. • Do NOT read this strictly as a radial-distribution function! Must do detailed FITS!
“Heuristic” derivation • In quantum mechanics, absorption is given by “Fermi’s Golden Rule”: Note, this is the same as saying this is the change in the absorption per photoelectron
How is final state wave function modulated? • Assume photoelectron reaches the continuum within dipole approximation:
How is final state wave function modulated? • Assume photoelectron reaches the continuum within dipole approximation:
How is final state wave function modulated? • Assume photoelectron reaches the continuum within dipole approximation: central atom phase shift c(k)
How is final state wave function modulated? • Assume photoelectron reaches the continuum within dipole approximation: central atom phase shift c(k) electronic mean-free path (k)
How is final state wave function modulated? • Assume photoelectron reaches the continuum within dipole approximation: central atom phase shift c(k) electronic mean-free path (k) complex backscattering probability f(,k)
How is final state wave function modulated? • Assume photoelectron reaches the continuum within dipole approximation: central atom phase shift c(k) electronic mean-free path (k) complex backscattering probability f(,k) complex=magnitude and phase: backscattering atom phase shift a(k)
How is final state wave function modulated? • Assume photoelectron reaches the continuum within dipole approximation: central atom phase shift c(k) electronic mean-free path (k) complex backscattering probability kf(,k) complex=magnitude and phase: backscattering atom phase shift a(k) final interference modulation per point atom!
Other factors Assumed both harmonic potential AND k<<1: problem at high k and Assumed plane wave scattering, curved wave has r-dependence solution: substitute Feff full curved wave theory • Allow for multiple atoms Ni in a shell i and a distribution function function of bondlengths within the shell g(r) where and S02 is an inelastic loss factor
EXAFS equation derivation The probability of emitting an electron in the direction is given by: • This “simple” version is from the Ph.D. thesis of Guoguong Li, UC Santa Cruz 1994, adapted from Teo, adapted from Lee 1974. See also, Ashley and Doniach 1975. The absorption is therefore: where: -
derivation continued… • Some, er, “simplifications”:
Rewrite I1, I2 and I3 derivation continued…
Finishing derivation, beginning polarization • Notice (angle w.r.t. polarization): can eliminate certain peaks!
L2 and L3 edges appear more complicated • 2p1/2 or 2p3/2 core hole and a mixed s and d final state Heald and Stern 1977
polarization vs. spherically averaged • L2 and L3 mostly d final states (yeah!) Stern 1974 Heald and Stern 1977
Corrections and Concerns • “Normal” EXAFS performed on powder samples in transmission • can tune the thickness • Want t~<1 and t < 3 • We like stacking strips of scotch tape • can make a flat sample • diffraction off the sample not a problem • Working with oriented materials: single crystals, films • usually cannot get the perfect thickness: too thick • fluorescence mode data collection • self-absorption can be substantial! • dead-time of the detector
Fluorescence mode EK E fluorescing photon trajectory incident photon trajectory x y z d Sample point of absorption and fluorescence continuum unoccupied states EF 2p filled 3d 1s core hole
EK E fluorescing photon trajectory incident photon trajectory x y z d Sample point of absorption and fluorescence • Fluorescing photon can be absorbed on the way out • Competing effects: • glancing angle, sample acts very thick, always get a photon, XAFS damped • normal-incidence: escaping photon depth fixed L. Tröger , D. Arvanitis, K. Baberschke, H. Michaelis, U. Grimm, and E. Zschech, Phys. Rev. B 46, 3283 (1992).
The full correction • With the above approximation, we can finally write the full correction: where • In the thick limit (d), this treatment gives: Booth and Bridges, Physica Scripta T115, 202 (2005)
L. Tröger , D. Arvanitis, K. Baberschke, H. Michaelis, U. Grimm, and E. Zschech, Phys. Rev. B 46, 3283 (1992).
Correction applied to a 4.6 m Cu foil • Data collected on BL 11-2 at SSRL in transmission and fluorescence using a 32-element Canberra germanium detector, corrected for dead time.
Fitting the data to extract structural information • Fit is to the standard EXAFS equation using either a theoretical calculation or an experimental measurement of Feff • Typically, polarization is spherically averaged, doesn’t have to be • Typical fit parameters include: Ri, Ni, i, E0 • Many codes are available for performing this fits: • EXAFSPAK • IFEFFIT • SIXPACK • ATHENA • GNXAS • RSXAP
FEFF: a curved-wave, multiple scattering EXAFS and XANES calculator • The FEFF Project is lead by John Rehr and is very widely used and trusted • Calculates the complex scattering function Feff(k) and the mean-free path TITLE CaMnO3 from Poeppelmeier 1982 HOLE 1 1.0 Mn K edge ( 6.540 keV), s0^2=1.0 POTENTIALS * ipot z label 0 22 Mn 1 8 O 2 20 Ca 3 22 Mn ATOMS 0.00000 0.00000 0.00000 0 Mn 0.00000 0.00000 -1.85615 0.00000 1 O(1) 1.85615 0.00000 1.85615 0.00000 1 O(1) 1.85615 -1.31250 0.00000 1.31250 1 O(2) 1.85616 1.31250 0.00000 -1.31250 1 O(2) 1.85616 1.31250 0.00000 1.31250 1 O(2) 1.85616 -1.31250 0.00000 -1.31250 1 O(2) 1.85616 0.00000 1.85615 -2.62500 2 Ca 3.21495 -2.62500 1.85615 0.00000 2 Ca 3.21495 -2.62500 -1.85615 0.00000 2 Ca 3.21495 0.00000 1.85615 2.62500 2 Ca 3.21495
Phase shifts: functions of k • sin(2kr+tot(k))): linear part of (k) will look like a shift in r slope is about -2x0.35 rad Å, so peak in r will be shifted by about 0.35 Å • Both central atom and backscattering atom phase shifts are important • Can cause CONFUSION: sometimes possible to fit the wrong atomic species at the wrong distance! • Luckily, different species have reasonably unique phase and scattering functions (next slide) R=1.85 Å R=3.71 Å
Species identification: phase and magnitude signatures • First example: same structure, first neighbor different, distance between Re and Ampmax shifts • Note Ca (peak at 2.8 Å) and C have nearly the same profile • Magnitude signatures then take over • Rule of thumb is you can tell difference in species within Z~2, but maintain constant vigilance!
More phase stuff: r and E0 are correlated • When fitting,E0 generally is allowed to float (vary) • In theory, a single E0 is needed for a monovalent absorbing species • Errors in E0 act like a phase shift and correlate to errors in R! consider error in E0: ktrue=0.512[E-(E0+)]1/2 for small , k=k0-[(0.512)2/(2k0)] eg. at k=10Å-1 and =1 eV, r~0.013 Å • This correlation is not a problem if kmax is reasonably large • Correlation between N, S02 and is a much bigger problem!
Information content in EXAFS • k-space vs. r-space fitting are equivalent if done correctly! • r-range in k-space fits is determined by scattering shell with highest R • k-space direct comparisons with raw data (i.e. residual calculations) are incorrect: must Fourier filter data over r-range • All knowledge from spectral theory applies! Especially, discrete sampling Fourier theory…
Fourier concepts • highest “frequency” rmax=(2k)-1 (Nyquist frequency) eg. for sampling interval k=0.05 Å-1, rmax=31 Å • for Ndata, discrete Fourier transform has Ndata, too! Therefore… FT resolution is R=rmax/Ndata=/(2kmax), eg. kmax=15 Å-1, R=0.1 Å • This is the ultimate limit, corresponds to when a beat is observed in two sine wave R apart. IF YOU DON’T SEE A BEAT, DON’T RELY ON THIS EQUATION!!
More Fourier concepts • Assuming Ndata are independent data points, and a fit range over k (and r!): • Fit degrees of freedom =Nind-Nfit • Generally should never have Nfit>=Nind (<1) • But what does this mean? It means that For every fit parameter exceeding Nind, there is another linear combination of the same Nfit parameters that produces EXACTLY the same fit function
Systematic errors: calculations are not perfect! Kvitky, Bridges and van Dorssen, Phys. Rev. B 64, 214108 (2001).
Systematic vs. Random error • Systematic errors for nearest-neighbor shells are about 0.005 Å in R, 5% in N, 10% in (Li, Bridges, Booth 1995) • Systematic error sources: • sample problems (pin holes, glitches, etc.) • correction errors: self-absorption, dead time, etc. • backscattering amplitudes • overfitting (too many peaks, strong correlations between parameters) • Random error sources: • some sample problems (roughly, small sample and moving beam) • low counts (dilute samples)
Systematic vs. Random error Statistics:
Error analysis options • Use error analysis in fitting code (generally from the covariance matrix) • Always requires assumptions • a single error at all r or k is assumed • systematic errors ignored • can be useful in conjunction with other methods • Collect several scans, make individual fits to each scan, calculate standard deviation in parameters pi • Fewer assumptions • random errors treated correctly as long as no nearby minima in 2(pi) exist • systematic errors lumped into an unaccounted shift in <pi> • Best method(?): Monte Carlo
EXAFS as a technique is not count-rate limited: It is limited by the accuracy of the backscattering functions • This does NOT mean that you should ignore the quality of the fit! • DO a Chi2 test, observe whether Chi2=degrees of freedom • one limit: random noise is large, and you have a statistically sound fit • other limit: random noise is small, and you will then know how large the problem with the fit is
not so Advanced Topic: F-test • F-test, commonly used in crystallography to test one fitting model versus another F=(12/1)/(02/0)0/1R12/R02 (if errors approximately cancel) alternatively: F=[(R12-R02)/(1-0)]/(R02/0) • Like 2 , F-function is tabulated, is given by incomplete beta function • Advantages of a 2-type test: • don’t need to know the errors!
Example and limitations • consider 4 different samples with various amount of species TcSx: Are they interconnected? • r=4.5-1 Å k=13.3-2 Å-1, n=26.8 • model 0 has Tc neighbors and m=14 parameters, R0=0.078 to 0.096 • model 1 has only S neighbors and m=10, R0=0.088 to 0.11 • dimension of the hypothesis b=14-10=4 • each data set, between 35 and 82%, all together 99.9% • Effect of systematic error: increases R0 and R1 same amount • This will decrease the % improvement, making it harder to pass the F-test (right direction!) • Failure mode: fitting a peak due to systematic errors in Feff
Finishing up • Never report two bond lengths that break the rule • Break Stern’s rule only with extreme caution • Pay attention to the statistics
Further reading • Overviews: • B. K. Teo, “EXAFS: Basic Principles and Data Analysis” (Springer, New York, 1986). • Hayes and Boyce, Solid State Physics 37, 173 (192). • Historically important: • Sayers, Stern, Lytle, Phys. Rev. Lett. 71, 1204 (1971). • History • Lytle, J. Synch. Rad. 6, 123 (1999). (http://www.exafsco.com/techpapers/index.html) • Stumm von Bordwehr, Ann. Phys. Fr. 14, 377 (1989). • Theory papers of note: • Lee, Phys. Rev. B 13, 5261 (1976). • Rehr and Albers, Rev. Mod. Phys. 72, 621 (2000). • Useful links • xafs.org (especially see Tutorials section) • http://www.i-x-s.org/ (International XAS society) • http://www.csrri.iit.edu/periodic-table.html (absorption calculator)
Further reading • Thickness effect: Stern and Kim, Phys. Rev. B 23, 3781 (1981). • Particle size effect: Lu and Stern, Nucl. Inst. Meth. 212, 475 (1983). • Glitches: • Bridges, Wang, Boyce, Nucl. Instr. Meth.A 307, 316 (1991); Bridges, Li, Wang, Nucl. Instr. Meth. A 320, 548 (1992);Li, Bridges, Wang, Nucl. Instr. Meth. A 340, 420 (1994). • Number of independent data points: Stern, Phys. Rev. B 48, 9825 (1993). • Theory vs. experiment: • Li, Bridges and Booth, Phys. Rev. B 52, 6332 (1995). • Kvitky, Bridges, van Dorssen, Phys. Rev. B 64, 214108 (2001). • Polarized EXAFS: • Heald and Stern, Phys. Rev. B 16, 5549 (1977). • Booth and Bridges, Physica Scripta T115, 202 (2005). (Self-absorption) • Hamilton (F-)test: • Hamilton, Acta Cryst. 18, 502 (1965). • Downward, Booth, Lukens and Bridges, AIP Conf. Proc. 882, 129 (2007). http://lise.lbl.gov/chbooth/papers/Hamilton_XAFS13.pdf