Download
1 / 35
370 likes | 631 Views
Earth and Space Science: TEK 11 b; c; and d. (11) Solid Earth. The student knows that the geosphere continuously changes over a range of time scales involving dynamic and complex interactions among Earth's subsystems. The student is expected to:

E N D
Earth and Space Science: TEK 11 b; c; and d • (11) Solid Earth. The student knows that the geosphere continuously changes over a range of time scales involving dynamic and complex interactions among Earth's subsystems. The student is expected to: • (b) explain how plate tectonics accounts for geologic surface processes and features, including folds, faults, sedimentary basin formation, mountain building, and continental accretion; • Students understand how tectonics affect topography • (c) analyze changes in continental plate configurations such as Pangaea and their impact on the biosphere, atmosphere, and hydrosphere through time; • (d) interpret Earth surface features using a variety of methods such as satellite imagery, aerial photography, and topographic and geologic maps using appropriate technologies Vocabulary: Orogeny
Tectonics: Surface Processes and Features Folds • As you have already learned, tectonic processes originate within the planet and produce movements of the Earth's crust. • There are basically two types of pressures exerted on the crust: • Compression • Tension has a tendency to shorten the Earth's surface ,resulting in the wrinkling of the crust. What type of plate boundary may this process occur at? Convergent causes the crust to crack or fracture, while pulling it apart. Tension tends to stretch or expand the surface. What type of plate boundary may this process occur at? Divergent Folding refers to the wrinkling of the crust which occurs because of slow lateral compression. When layered flat strata are subjected to compressional forces, they are bent and deformed. Too much bending creates a break, or a fault. By far, most of the Earth-forces are compressional. Fold patterns may be simple or very complex in form, due to the varying intensity of the tectonic forces that produced them. Either way, they leave clues behind for geologists to interpret and discover their origins.
What are the two types of forces at work on the planet’s surface? What types of plate boundaries do you associate with compression forces? What types of plate boundaries do you associate with tension forces? Compression forces cause f__________ of sediment, and f__________ appear when too much of this occurs.
Various shapes and forms of folding are the following: Monocline: The simplest type of fold. It involves only one inclination of the rocks. In a monocline the fold is bent in one direction only. Anticline: When the pressure exerted on a rock is not great, a series of simple folds are produced. In such folds the arches or up-folds, or crests, are called anticlines. Syncline: In a simple fold, the troughs or down-folds are called synclines. The sides of the folds between the anticlinal crests and synclinal troughs are called the fold limbs. Recumbent Fold: A fold in which the limbs (waves) are largely horizontal. Geologically speaking, it is inferred that these folds were at one time vertical, and through extreme geologic upheaval, have been “upended”.
Faults When rock strata are strained beyond their ability to fold, and retain their solid state as a unit, they fracture, or break. When a fracture occurs and the rocks are displaced on either side of it relative to one another, the result is known as a fault, and the process is faulting. • Faults often occur in groups along a fault zone. Some faults displace rocks up and down. This is called vertical displacement. • Some faults cause lateral displacement or sideways movements. • When there are sudden slippage movements, it generates earthquakes. A single fault movement may result in slippage ranging from a centimeter to about 15 meters. Such slippage may occur in quick succession or may occur after gaps of several decades or centuries. The cumulative displacement may involve as much as hundreds of kilometers.
Type of fold represented in this photo: The crests of this fold are known as: The troughs in this fold are known as: The simplest fold is known as a:
The tension fault or normal fault: A normal fault occurs where tension causes fracture in rocks that are being pulled apart. The rock above the fault plane moves down relative to the rock beneath the fault plane. The reverse fault or thrust fault: Reverse fault occurs where compressional force causes the upper block of rock to be pushed over the lower. As a result of compressional forces there is shortening of the crust. The strike-slip fault: A strike-slip fault is a fault on which the two blocks slide past one another. These faults are identified as either right-lateral or left lateral depending on whether the displacement of the far block is to the right or the left when viewed from either side. The San Andreas Fault in California is an example of a right lateral fault. Types of Faults
A _________ fault, or normal fault is caused by tension forces, pulling the pieces apart. A ________ fault, is the result of compression forces, pushing the pieces together. The _____________ fault is the result of lateral movement. Strike-slip faults form along ____________ plate boundaries.
Tectonics: Surface Processes and Features Sedimentary Basin Formation Sedimentary basins are created by depressions (dips) in the surface of the lithosphere associated with tectonic processes. These topographic and bathymetric (beneath the water) basins are subsequently filled by sediment, leading to further subsidence and sediment accumulation. Sedimentary basins are important, because petroleum is most often found in such locations. A sedimentary basin is a depressed area of the Earth’s crust where tiny plants and animals lived or were deposited with mud and silt from streams and rivers. These sediments eventually hardened to form sedimentary rock. The soft parts of plants and animals, exposed to heat and pressure over millions of years, gradually changed to oil and natural gas. Coal is formed from the remains of ancient fern-like trees that died in swamps, and were compressed over the millennia. Temperature, pressure and compaction of sediments increase at greater depths.
Tectonics: Surface Processes and Features Mountain Building: Orogeny The terms orogeny and orogenesis involve tectonic processes that result in the formation of mountain chains. Mountain building most commonly involves the collision between two continental lithospheric plates. Because continental plates are of relatively equal density, when they converge, they crinkle up. These are known as “folded mountains”. When the plates carrying Africa and Saudi Arabia, along with other smaller plates, collided (from the south) with Eurasia in the north, the Alps formed. When these boundaries form subduction zones, most often, volcanic mountains arise, such as the Andean orogenics. It results from the subduction of the oceanic Nazca plate underneath the South American continent. Collision follows subduction of oceanic lithosphere beneath one continent.
Topographic features are found ___________ ___________ means the “origin” of mountains. Bathymetric features are found____________ Describe the two different types of mountains, and what types of plate boundaries they may form along. Give examples of each. Sedimentary basins are especially important because this is where ________________ form.
Tectonics: Surface Processes and Features Continental Accretion • Accretion is a process by which material is added to a tectonic plate or a landmass. There are two possible ways this may happen. • Tectonic Accretion: • Volcanic island arcs or seamounts may collide with the continent, and as they are of relatively light material, they will often not be subducted, but are thrust into the side of the continent, thereby adding to it. • Landmass Accretion: • This involves the addition of sediment to a coastline or riverbank, increasing land area via erosion and deposition. The most noteworthy landmass accretion is the deposition of alluvium, often containing precious metals, on riverbanks and in river deltas. Amazon Alluvial Deposit
Give an example of tectonic accretion. Give an example of landmass accretion.
Continental Plate Configuration Impact: Supercontinents Pannotia; a time of great glaciation Formation of supercontinents, such as Rodinia, greatly influences climate. Climate influences life. Since Rodinia formed during a time when life consisted only of bacterial forms, such as stromatolites, it must have been a vast and desolate place. Life had not yet colonized land. The eight continents which made up Rodinia later reassembled briefly into another super continent Pannotia, and again into Pangaea. Rodinia produced some significant changes in the Earth. It was the largest landmass to have existed up till that time. It significantly changed ocean currents, which may have led to snowball Earth later in the Cryogenian.
Continental Plate Configuration Impact: Environments The formation of a supercontinent can dramatically affect the environment. The collision of plates will result in mountain building, thereby shifting weather patterns. Sea levels may fall because of increased glaciation in mountains and continental interiors. They may also rise if there is excessive glaciation causing isostatic pressure in the mantle. The rate of surface weathering can rise, resulting in an increase in the rate that organic material is buried… and the formation of sedimentary basins. The formation of a supercontinent insulates the mantle. The flow of heat will be concentrated, resulting in volcanism and the flooding of large areas with basalt. Increased volcanism leads to increased greenhouse gases, and global warming. Notice here that the hottest areas on the planet are right over Pangea during this period. CAMP, or Central America Magmatic Province
Why didn’t the formation of the supercontinent Rodinia influence the biosphere as much as Pangea did? How does mountain building due to continental collision affect climate?
Continental Plate Configuration Impact: Biosphere Land and sea barriers generated by continental drift have influenced distribution of life on the Earth by restricting movements of both plants and animals. Organisms that arose and diversified on an ancient landmass, such as Gondwana, were prevented by large sea barriers from colonizing other landmasses. Diversity of life is a consequence of isolation. Less isolation, means less diversification. This occurs during supercontinent formation, producing both one continent and one ocean with one coast. Because genes (heritable units of organisms) are allowed to “flow”, evolution slows down. Break-up events result in the tremendous proliferation of diversity of life forms. Gene “flow” is hindered. Plate tectonics recycles water, carbon and nitrogen, creating an environment that is perfect for life. It makes oceans open and close, mountains rise and fall and continents gather and split. Every 500 to 700 million years, tectonics brings the continents together to form a supercontinent. When these supercontinents slowly break up, separating landmasses and forming shallow seas, evolution goes into overdrive, forming countless new species which colonize the new habitats. Tectonics can move a continent from a tropical to a polar latitude, where the organisms will experience new patterns of competition. Breakup of Pannotia Formation of Pangea Breakup of Pangea Panthalasa
Continental Plate Configuration Impact: What does each of these animals have in common? Not only are they all marsupials, or special mammals who birth embryos that are nurtured within pouches, but they all are currently found in the wild, only in Australia. They began evolving near the breakup of the supercontinent, Pangea, which went on to form Laurasia and Gondwana. Biosphere Tasmanian Devil During in the Triassic Period and later, the break up of Pangea played a significant role in the evolution of all marsupials, especially those in the Americas and Australia. They were unable to compete in Asia and Europe, and became extinct there. Tectonics provides an explanation for the vast number of different species of marsupials in Australia, but the relative rarity of marsupials elsewhere. Marsupials were able to adapt and compete successfully only in Australia. Evolutionarily, adaptation is what it’s all about! Wombat Wallaby Opossum: Only remaining marsupial in North America
Formation of supercontinents often is accompanied by _________ diversification of life forms, due to increased gene flow. Break-up of supercontinents leads to ___________ , which influences huge diversification events. What types of barriers do plate tectonics provide that influence evolutionary events? Why are there currently more marsupials on Australia than on any other continent?
Plate Configuration Impact: Atmosphere and Hydrosphere Throughout the Pangea period, due to the reconfiguration of the continents and oceans, global atmospheric circulation patterns changed. Atmospheric warming was caused by expansion of magma beneath Pangea. Carbon is cycled tthrough tectonics as well. Carbon dioxide is released into the atmosphere by volcanic activities. CO2 will warm up the air, and cause more seawater to evaporate. Acidic rain reduces the amount of CO2 by producing carbon-containing minerals, which is carried into the mantle by plate tectonics, and eventually returns to the atmosphere through volcanoes to repeat the cycle again. Atmospheric Circulation: During Pangea Interestingly, this planetary self-help method of climate regulation may not work very well if the CO2 released by human activities becomes too much for the slow process of plate tectonics to handle! During the time of Pangea, global circulation patterns were affected. When the Australian and South American continents broke away from Antarctica approximately 38 mya, oceanic currents in the newly formed Southern Ocean created a circumpolar current. This in turn led to atmospheric currents that rotated from west to east. Both these atmospheric and oceanic currents stopped the transfer of warm tropical air and water to the higher latitudes. This ultimately led to the cooling of the Antarctic continent.
Plate Configuration Impact: Hydrosphere and Atmosphere • The thermal plumes that arise during supercontinent buildup result in: • warming atmospheres, which results in: • sea level rise due to thermal expansion of water, which results in: • the melting of the ice sheets, changing the weight on the continents beneath, changing isostatic pressure, which results in: • localized sea-level change as the land rebounded with the removal of ice, which results in: • increased precipitation as snow and ice over Greenland, ultimately leading to a build up of the ice cap, which results in: • average albedo increase, which leads to further global cooling. • This is cyclical in nature, as seen by this graphic representation of global temperatures through geologic time • As you saw on the last slide, there is an unavoidable connection between atmospheric circulation, and oceanic circulation patterns. They both affect climate greatly. When the North and South American continents joined around 3 mya forming the isthmus of Panama, (historically known as the Isthmus of Darien) this had the effect of stopping equatorial currents passing from the Atlantic to the Pacific. . It has been shown that this strengthened the Gulf Stream by diverting more equatorial (warm) currents northwards towards Europe. In doing so, warm waters at high latitudes led to increased evaporation and therefore atmospheric moisture. Today, evaporation in the tropical Atlantic and Caribbean leaves behind saltier ocean waters and puts fresh water vapor into the atmosphere. Trade Winds carry the water vapor westward across the low-lying isthmus, depositing fresh water into the Pacific through rainfall. As a result, the Atlantic is saltier than the Pacific Sea level is generally lower during the time of supercontinents, and higher when they break apart. This is because the age of the oceanic lithosphere provides a major control on the depth of the ocean basins, and therefore on global sea level. Let’s take a look at the cycle.
Continental Plate Configuration Impact: The future In the next 50 to 200 million years, all of Earth’s continents will be once again pushed together into a supercontinent. The proposed supercontinent, Amasia, will be centered around the North Pole. This conclusion comes from a computer model that shows the slow movements of the continents over the next several millions of years. How will this supercontinent affect global circulation patterns, and climate? Will humans be here to see it? Considering the fact that the greatest mass extinction in Earth's history happened at the same time Pangaea formed 250 million years ago, the formation of a supercontinent in the future may eventually cause extinctions on a similar scale. The lessons from these vast geologic and geographic changes is both simple and exceedingly complex. As you’ve seen, the opening and closing of seaways has a profound influence on the distribution of fresh water, nutrients, and energy in the global ocean. The coupling of these changing oceans with a changing atmosphere inevitably means a changing climate.
Describe how CO2 is recycled in plate tectonics, and how it plays a role in planetary temperatures. What is the danger of increased human CO2 formation? How did the break-up of Pangea, particularly Antarctica from South America and Australia, lead to a colder climate for Antarctica? How does a strengthening Gulf Stream influence global temperatures? Which ocean is saltier, and why? When did this happen?
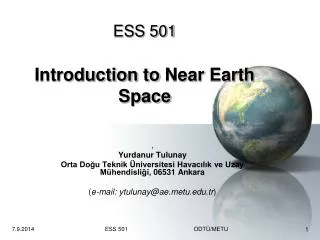
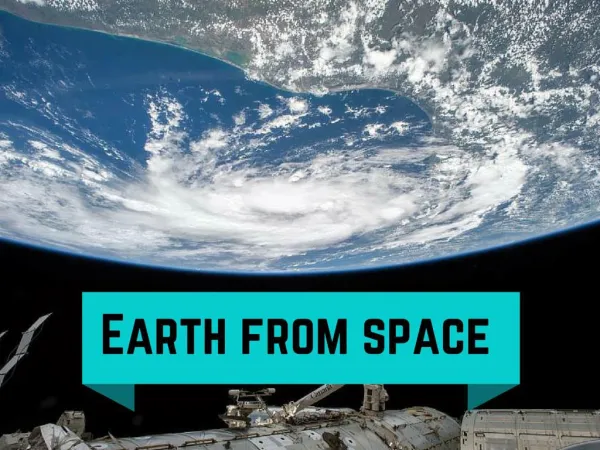
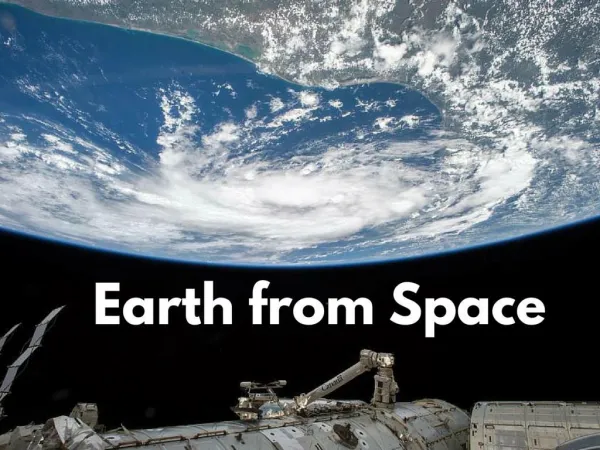
Interpreting Earth’s Surface Satellite Imagery Satellite imagery consists of photographs of Earth made by means of artificial satellites. Mt. Cotopaxi Satellite images have many applications including meteorology, geology, forestry, intelligence and warfare. Images can be in visible colors and in other spectra, such as infrared. There are also elevation maps, usually made by radar images. Interpretation and analysis of satellite imagery is conducted using specialized remote sensing applications. Some of the first image enhancement of satellite photos was conducted by the U.S. Government and its contractors. Satellite imagery is also used in seismology and oceanography in deducing changes to land formation, water depth and sea bed, by color caused by earthquakes, volcanoes, and tsunamis. The transceiver, in turn, relays the message via a satellite data link to a control centre onshore. Satellite photography can be used to produce composite images of an entire hemisphere or to map a small area of the Earth, such as this photo of the countryside of Haskell County, Kansas, United States.
Interpreting Earth’s Surface Ariel Photography Aerial photography is the technique of capturing photographs of the land from an elevated location. This type of photography usually refers to photographs which are taken when the camera is not supported by a ground-based structure. The camera in aerial photography may be hand held or mounted, and photographs may be taken by a photographer, triggered remotely, or triggered automatically. Aerial photography can produce some very inspirational photographs that provide us a beautiful view of our Earth’s surface from a perspective that we never see.
Aerial Photography in Science Unlike maps, which portray the physical and cultural landscape with generalized symbols and colors, aerial photography reveals the terrain as it exists in nature. All buildings, bridges, roads, urban and rural areas, and other man-made features are depicted as they were at the time of photography. Physical features, such as vegetation type and distribution, river widths and courses, shorelines, landslide areas, etc. are shown with detail that no map can depict. Aerial photography is extremely useful both for site evaluation and for regional analysis, as well as for historical perspectives. It is used by engineers, architects, city and regional planners, geographers, geologists and historians.
How can we use infrared light in satellite imaging? Describe passive vs. active satellite sensing. Aerial photography can be accomplished both by an actual photographer, or _____________, using robotics. What are two positives of using aerial photography over some other surface interpretation technique?
Interpreting Earth’s Surface Topographic Maps A topographic map, also known as a topo map, is a map which shows changes in elevation by using contour lines. Contour lines are imaginary lines that join points of equal elevation on the surface of the land above or below a reference surface such as average sea level. Contour lines make it possible to show the height of mountains, depth of the ocean bottom, (on a special topo map known as a bathymetric map) and steepness of slopes on a topo map. To visualize what a contour line represents, picture a mountain (or any other topographic feature) and imagine slicing through it with a perfectly flat, horizontal piece of glass.
The contour interval is the difference in elevation between two adjacent contour lines on a topo map. You can determine the contour interval by counting the number of contours between labeled index contours and then by using this formula: For example, on the map shown here, you can see that there are 15 contour lines between the 2400 index contour and the 1800 index contour. So the contour interval is calculated as follows: The Contour Interval Contour Interval: 40 ft.
Things to Remember… 1919 Close line =Steep Slope The steepest slopes on the map can be seen by looking for lines that are very close together. Since each line represents a change in elevation of a set amount (20 meters in this example), lines that are close together indicate steep gradients. The area circled in red is very steep, because it has many lines crowded close together. Contour lines bend upstream when crossing a river Since contour lines must remain at the same elevation, they must bend when they cross riverbeds. A riverbed drops downward, so the contour line must bend uphill to stay at the same elevation. The highlighted lines show that the direction of the Mill River must be northeast. Highest possible elevation of a hill The highest elevation of a hill can be calculated by finding the last (highest) contour line on that hill, and then figuring out the next line that would be drawn. The highest possible elevation of the hill is just below the value of that next line. The highest possible elevation of the hill indicated by the arrow is 239 meters. The last line indicated on the map is 220 meters. The next line would be 240 meters (remember that the contour interval is 20 meters). Since there is no 240 meter line, the hill cannot be higher than 239 meters! Depressions are shown by small marks pointing inward off the contour line The arrow is pointing to a depression, or hole. The contour line with the marks, or hatchers, has the same elevation as the line before it. In this case the hatchered line has a value of 140 meters, and the depression must be less than 140 meters. Present Day • One of the most important sources of information on a topographic map is the date of revision. Although large scale topographic features (such as mountains) take millions of years to be formed and eroded, other features, such as volcanoes and river channels, may change on a much more rapid scale. • volcanic eruptions, flooding, landslides may alter topography significantly, roads are added or go out of use, etc.
Interpreting Earth’s Surface Geologic Maps • Geologic maps, like all maps, are designed to show where things are. • Unlike the maps we are used to which show the distribution of roads or rivers or county boundaries, a geologic map shows the distribution of geologic features, including different kinds of rocks and faults. • A geologic map is usually printed on top of a regular map (called a base map) to help you locate your location on the map. The base map is printed with light colors, so it doesn’t interfere with seeing the geologic features on the map. • The geology is represented by colors, lines, and special symbols unique to geologic maps. Understanding these features will allow you to understand much of the geology shown in almost any standard geologic map. The most striking features of geologic maps are its colors. Each color represents a different geologic unit. A geologic unit is a volume of a certain kind of rock of a given age range. So a sandstone of one age might be colored bright orange, while a sandstone of a different age might be colored pale brown.
Geologic Map Symbols Although the geology of every area is different, all geologic maps have several features in common: colored areas and letter symbols to represent the kind of rock unit at the surface in any given area, and lines to show the type and location of contacts and faults.
Local Geologic Map The geology of an area has a profound effect on many things, from the likelihood of landslides, to the availability of groundwater in wells, from the amount of shaking suffered in an earthquake, to the presence of desirable minerals, from the way the landscape is shaped to the kinds of plants that grow best there. Understanding the earth underneath is the first step in understanding the world around us. So what’s the geology like in your neighborhood?
___________ on topographic maps are lines that join points of equal elevation. One contour line is at 4,000 meters, and another, higher up the mountain, is at 5,600 meters. There are 8 contours crossed between the two. What is the contour interval? On a contour map, the ___________ the lines are together, the _____________ the slope. Calculate the contour interval on this map, in meters, and determine the highest possible elevation of hill C. How are depressions depicted on a contour map?
Why is the revision date on a topographic map of an area depicting rivers and volcanoes more important than on topographic maps showing other areas? What feature makes it easier to interpret you location on a geologic map? Describe the geological foundation of our area, and determine within which geologic period it was laid.