Download
1 / 22
220 likes | 392 Views
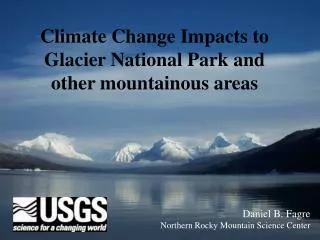
Climate Change: Science Basics and Impacts Around the Great Lakes. Jeffrey C. Rogers Department of Geography and Atmospheric Science Program State Climate Office for Ohio The Ohio State University May 6, 2010 Ohio State University Climate Change Webinar Series

E N D
Climate Change: Science Basics and Impacts Around the Great Lakes Jeffrey C. Rogers Department of Geography and Atmospheric Science Program State Climate Office for Ohio The Ohio State University May 6, 2010 Ohio State University Climate Change Webinar Series Climate Change & Water Resource Impacts in the Great Lakes Region
Overview • Scientific basics of climate change associated with global warming. • The gases, their sources, temporal changes, role in climate change. • Currently observed & the Predicted changes in both air temperature and in rainfall intensity. • Potential changes in Great Lakes precipitation patterns and water levels.
What are Greenhouse Gases? • Greenhouse gases (i) absorb outward bound infrared radiation from the earth’s surface. (ii) Delay the return of infrared radiation to space (iii) warm the atmosphere. • The “greenhouse effect” modulates radiation in the earth-atmosphere system.
Increasing GHG Concentrations N2O Methane
Earth with Greenhouse Gases With Greenhouse gases (CO2 and H2O vapor) the planet’s average temperature fluctuates around +59ºF. This is 60ºF warmer than with no greenhouse gases 40F° is contributed by H2O vapor, 20F° by CO2 Our societal debate is whether the observed increases in GHGs will increase the air temperature beyond 59°F, to 60°F, 61°F, etc. Carina Van Vliet
Aerosols & Sulfate • Aerosols: Tiny particles & liquid droplets from burning of fossil fuels that also have radiative effects in our atmosphere. • Sulfates are aerosols from coal & oil burning; they backscatter solar radiation & cool the climate. “Global dimming”.
Attribution of Climate Change to Human Activities • Modeled climate change (shaded gray) is close to observed variability (black line). • The climate change is the sum of the “forcings” shown at bottom, producing a net warming. • Natural forcings neutral. • Modeled climate: DOE parallel climate model Meehl et al (2004; J. Climate)
Annual Air Temperature Trends 1900-2006 Rogers, 2010; J. Climate (submitted)
Plants, Crops, & Climate Change 1990 USDA plant hardiness zones (based on 1974-1986 data) 2006 Nat’l Arbor Day Foundation (based on weather service data 1991-2005)
“…biggest impacts of global warming will come in the form of changes in weather and climate extremes.” More heat waves Drought more frequent & severe in some regions Precipitation will be less frequent but more intense, high rainfall events more common. The U.S. Climate Change Science Program (6/19/08)
Trends in Heavy Precipitation Periods, 1931-1996 • Heavy precipitation events have already increased. • Consistent with increases in atmospheric water vapor associated with human-caused greenhouse gas increases. • Precipitation has become less frequent but more intense. (Kunkel, Andsager and Easterling, 1999)
One Inch Rain Days per Year: Ohio 1900-1910 Dayton: 6 days Columbus: 4.5 days Cleveland: under 4 days 2000’s Dayton: Over 9 days Columbus: ~ 8 days Cleveland: ~ 7 days
Alternating rainfall extremes • Consequences: flooding, property damage, increased fertilizer runoff. • Old community water/sewer systems may not be able to handle high rain events. • Consequences: Prolonged dry periods & drought; low soil moisture; reduced lake/stream levels, reduced community water storage; water conflicts.
Great Lakes Hydrologic Cycle Water input from precipitation (tan arrows) and flow from the basin streams (green) and upstream lakes (purple), plus ground water. Air temperature (& wind) controls Evaporation (red arrows) that removes water; as does flow out to other Lakes and to the Atlantic (purple). EPA: http://www.epa.gov/glnpo/atlas/glat-ch2.html
Changes in Great Lakes’ Levels • Will be driven by temperature, and therefore evaporation, increases. • In all models, precipitation changes little, within ± 10%.
A basin-wide Lake-effect snowfall event illustrating where the lake effect clouds and precipitation typically occur.
Warmer winters = less lake-effect snow • Southern Lakes: snows become rain more often. • Northern Lakes: Less ice but still cold, lake effect snow still common. HadCM2 model Reductions in Lake-effect snowfall Current Lake-effect snowfall Study conducted by Kunkel, Westcott, Kristovich; Illinois State Water Survey
Summary • Earth already has a substantial greenhouse environment, keeping the planet warmer than it should be. • Current temperature increases appear to be the result of warming by GHGs and cooling by sulfates. • Expectations for the future emphasize increased number of extreme events. • Large variations in precipitation. • More frequent high rain events, flooding & infrastructure strain • Longer dry spells in between, drought, agricultural problems • Future Great Lakes’ levels may succumb to increased evaporation.
References • Kunkel, K.E., K. Andsager, and D.R. Easterling, 1999: Long-term trends in extreme precipitation events over the con-terminous United States and Canada. J. Climate, 12, 2515-2527. • Meehl, G.A., W.M. Washington, C.A. Ammann, J.M. Arblaster, T.M.L. Wigleym and C. Tebaldi (2004). "Combinations of Natural and Anthropogenic Forcings in Twentieth-Century Climate". Journal of Climate17: 3721-3727. Wikipedia: global dimming • Rogers, J.C., 2010: The 20th century cooling trend over the southeastern U.S. Submitted to J. Climate.


![Facing the Impacts of Climate Change: Indian SMEs and Adaptation Training Programme [Date] [Time]](https://cdn3.slideserve.com/6765596/slide1-dt.jpg)