Download
1 / 83
830 likes | 1k Views
Climate Change Impacts to Glacier National Park and other mountainous areas. Daniel B. Fagre Northern Rocky Mountain Science Center. Eh?. Photo by Karl Birkeland/ FS NAC. Emphases of Program. Trends in ecosystem responses Underlying processes of ecosystem change

E N D
Climate Change Impacts to Glacier National Park and other mountainous areas Daniel B. Fagre Northern Rocky Mountain Science Center
Emphases of Program • Trends in ecosystem responses • Underlying processes of ecosystem change • Modeling of dynamics to project future
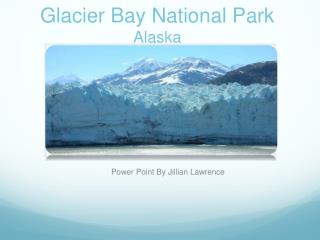
Grinnell Lake and Grinnell Glacier, 1910 Photo by Kiser, courtesy GNP Archives
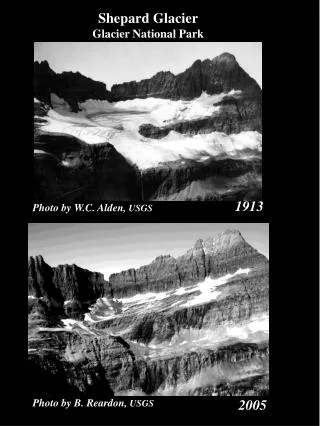
Grinnell Glacier from Mt. Gould 1998 Fagre/ USGS photo 2005 Reardon/ USGS photo 1981 Key/ USGS photo 1938 Hileman photo/ GNP Archives
Sperry Glacier 1850 1901 1913 1927 1938 1945 1959 1960 1966 1969 1979 1993
Agassiz 1993 – 1.02 Agassiz 1998 – 0.93 Blackfoot 1993 – 1.74 Blackfoot 1998 – 1.63 Chaney 1993 – 0.54 Chaney 1998 – 0.48 Old Sun 1993 – 0.42 Old Sun 1998 – 0.35 Rainbow 1993 – 1.21 Rainbow 1998 – 1.15 Red Eagle 1993 – 0.15 Red Eagle 1998 – 0.08 5 Years of Melting
Glacier Factoids • 150 in 1850 to 27 or less in 2006 • Less than 28% of the glacier area remains • Less than 10% of the glacier volume remains • Glaciers continue to disintegrate and melt
How much snow accumulates each winter? • Snow depth measurements • 0 – 7+m deep Sperry Glacier. June 24, 2005. Photos by Blasé Reardon and Dan Fagre.
How much mass accumulates each winter? • 560kg/m3 avg. density • 65-95” SWE Sperry Glacier. June 25, 2005. Dan Fagre photo.
How much mass melts each summer? • Ablation stakes Huecke Portable Ice Drill, courtesy Joel Harper UM Dept. of Geology
5.1m avg. height loss • 9cm/ day rate in snow • 4cm/ day rate in ice • .5 - 1.7m ice loss Sperry Glacier, Aug. 8, 2005. John Newton photo
How fast does Sperry flow? How deep is it? • Partnership w/UM Geology Dept. (Prof. Joel Harper & students) • Velocity (GPS) 3-5cm/day • Ice depth (10mHz radar) • Basic research into mass flux questions Joel Brown Photo
Aquatic invertebrate species distribution in response to stream temperature Minimal glacial runoff Hydropsyche cockerelli Present glacial runoff Arctopsyche grandis Parapsyche elsis
Three fish species from Glacier National Park, MT USA Native species Westslope cutthroat trout (Oncorhynchus clarki lewisi) Non-native species Brook trout (Salvelinus fontinalis) Rainbow trout (Oncorhyncus mykiss)
Pacific Basin Influences PDO Warm Phase PDO Cool Phase • The Pacific Decadal Oscillation (PDO) • El-Nino-like pattern of climate variability • 20-30 year cycles • North Pacific Phenomenon
Methods Climate Fluctuations • Modern instrumentation • Climate sensitive tree rings