Download
1 / 30
300 likes | 405 Views
Sustainable Water Resources Roundtable (SWRR) http://water.usgs.gov/wicp/acwi/swrr/ Criteria & Indicators . by Tim Smith SWRR Coordinator 703-860-1038. What Studies Exist about Sustainability?. Roundtables on Forestry, Rangelands, Minerals Sustainable Development in the U.S. (IWGSDI)

E N D
Sustainable Water Resources Roundtable (SWRR)http://water.usgs.gov/wicp/acwi/swrr/Criteria & Indicators by Tim Smith SWRR Coordinator 703-860-1038
What Studies Exist about Sustainability? Roundtables on Forestry, Rangelands, Minerals Sustainable Development in the U.S. (IWGSDI) State of the Nation’s Ecosystems (Heinz Center) EPA State of the Environment Report USGS Concepts for National Assessment of Water Availability and Use (Circular 1223)
What do we need to learn? • What criteria do others use to select good indicators? • How can these criteria be adapted for SWRR use? • What do others define as an indicator? • What water indicators do they use? • How can these indicators be used by SWRR? • What indicators might be added or deleted? • What is the SWRR rationale for thesechoices?
CriteriaWhat does the literature say makes a good indicator of sustainable development?* The indicator or the information from which it is calculated should be readily available.* The indicator should be relatively easy to understand.* The indicator must be about something that can be measured.* The indicator should measure something believed to be important in its own right.* There should be only a short time lag between the state of affairs referred to and the indicator becoming available.* The indicator should be based on information that can be used to compare different geographical areas.* International comparability is desirable. Source: Moffatt, Hanley, & Wilson, 2001 “Measuring & Modeling Sustainable Development”
CriteriaRoundtable on Sustainable Forestry Seven criteria for temperate and boreal forests are stated as goals: Criterion 4: Conservation & Maintenance of Soil and Water Resources (indicators 19,20,23,24,25)
CriteriaSustainable Rangelands Roundtable Five criteria are stated as goals, 4-17-03: • Conservation & maintenance of soil and water resources (indicators 5,6,7,8,9,10) II. Maintenance & conservation of plant and animal resources on rangelands (indicators 3,7)
Criteria (Oct.2002)Sustainable Minerals Roundtable Maintenance of Environmental Quality Goal Prioritization Criteria • Relevance to sustainable development • Science based, statistically valid estimate • Issue addressed, importance to stakeholders • Scale applicability, local, regional, national • Data availability for indicator • Resources exist to populate data for indicator
CriteriaSustainable Development in the U.S., IWGSDI • The indicator should represent an issue which is important to sustainable development. • The indicator should be understandable to a general audience, even if the methodology behind the indicator is more complicated. • The indicator should be quantifiable. • The indicator should be based on available data (indicators for future development may be based on data not currently available). • The indicator is national in scope or relevant to an issue of national concern. • The indicator is scalable to regional, state, and local levels if appropriate for the issue under consideration.
Criteria (Report Goals)State of the Nation’s Ecosystems, Heinz Center • Identify the “big picture” for policy debate. The indicator should provide substantial coverage. • Identify a succinct set of strategic indicators, that complement existing work. Data for indicators should be from ongoing programs. • Provide scientific information but avoid value judgments and policy recommendations. The indicator should be scientifically credible. • Focus on the state of national ecosystems, not pressure or response. • Indicators reflect both key ecosystem properties and goods and services from ecosystems. • Identify critical data gaps to be filled.
CriteriaEPA State of the Environment Report From www, 6-12-02 Expert Review Workshop Form Data Quality & Coverage 1. Do the indicator & the supporting data provide adequate geographical coverage for national reporting? 2. What is the quality of the data supporting the indicator? Uniformity? QA/QC? Methods? Suitability of Indicator 3. Is there a credible scientific basis for the indicator? 4. What are the limitations of this indicator? Use; Gaps.
CriteriaUSGS Circular 1223 • Data from existing programs should be used. • Indicators should be developed that are up-to-date, nationally consistent, and that reflect status and trends. • Indicators should comply with OMB Quality Guidelines. • Surface-water indicators should be reported at the spatial scale of the 352 river-basin hydrologic accounting units. • Ground-water indicators should be reported primarily by major aquifer system. • Most indicators should be reported and evaluated every 5 to 10 years. Some indicators should be reported annually. An initial 100 year retrospective should be done. • Development of indicator assessment should be coordinated through the Advisory Committee on Water Information (ACWI).
Indicators 19,20,23,24,25Roundtable on Sustainable Forestry 19 Area & percent of forestland managed primarily for protective functions, e.g., watersheds, flood protection, avalanche protection, riparian zones. 20 Percent of stream kilometers in forested catchments in which stream flow and timing has significantly deviated from the historic range of variation. 23 Percent of water bodies in forest areas (e.g., stream kilometers, lake hectares) with significant variance of biological diversity from the historic range of variability. 24 Percent of water bodies in forest areas (as above) with significant variation from the historic range of variability in pH, dissolved oxygen, levels of chemicals (electrical conductivity), sedimentation, or temperature change. 25 Area and percent of forest land experiencing an accumulation of persistent toxic substances.
Indicators (4-17-03)Sustainable Rangelands Roundtable I.5 Area & percent of rangeland with accelerated soil erosion by water or wind. I.6 Percent of water bodies in rangeland areas with significant changes in natural biotic assemblage composition. I.7 Percent of surface water on rangeland areas with significant deterioration of their chemical, physical, and biological properties from acceptable levels. I.8 Changes in ground water systems. I.9 Changes in the frequency and duration of surface no-flow periods in rangeland streams. I.10 Percentage of stream length in rangeland catchments in which stream channel geometry significantly deviates from the natural channel geometry. II.3 Number and extent of wetlands. II.7 Extent and condition of riparian systems.
Indicators (Oct.2002)Sustainable Minerals Roundtable EI 3. Ambient Environmental Indicators 3.1 Compliance status of mines and oil and gas with respect to water quality, under Clean Water Act or delegated state/tribal program, by 5th code hydrological unit watersheds; Number of 5th code hydrological unit watersheds with mines and oil and gas. 3.3 Number of permitted extraction or processing sites where water withdrawal causes environmental problems, relative to total number of permitted sites. 3.4 Ambient environmental quality: Number of permitted extraction sites where ground water is contaminated / total number of permitted sites. EI 4. Management of Extraction and Processing 4.1 Water use, recycling & discharge: Water use efficiency. Sectoral water use, consumption, discharge, loss to evaporation, reinjection.
IndicatorsSustainable Development in the U.S., IWGSDI • The study uses two national composite indicators, each made up of several statistics: I. Surface Water Quality: (A) Line graph showing trends for dissolved oxygen, fecal coliform bacteria, total dissolved lead, and total phosphorus. (B) Pie charts showing percent of assessed (1) rivers and streams; (2) lakes, ponds, and reservoirs; and (3) estuaries that support designated uses at a point in time.
Indicators IISustainable Development in the U.S., IWGSDI • The study uses two national composite indicators, each made up of several statistics: II. Ratio of Renewable Water Supply to Withdrawals: • Line graph of trend in the ratio over time. (B) Bar chart of fresh ground and surface water withdrawals in the U.S., over time.
Fresh Water IndicatorsState of the Nation’s Ecosystems, Heinz Center • System Dimensions (A) Extent: area and length (B) Alteration: extent of change • Chemical and Physical Conditions (A) Phosphorus in lakes, reservoirs, & large rivers (B) Nutrients: nitrogen & phosphorus in streams and ground water (C) Chemical contamination: pesticides, PCBs, heavy metals (streams, sediment, ground water, fish) (D) Changing stream flows (E) Water clarity (no data reported)
Fresh Water Indicators IIState of the Nation’s Ecosystems, Heinz Center • Biological Components • At-risk native species: number • Non-native animal species: number • Animal deaths and deformities: number • Status of freshwater animal communities (no data reported) • At-risk wetland & riparian plant communities: number (G) Stream habitat quality (no data reported)
Fresh Water Indicators IIIState of the Nation’s Ecosystems, Heinz Center • Human Uses • Water withdrawals: quantity, use • Ground water levels: rate of change (no data reported) • Waterborne human disease outbreaks: frequency (D) Freshwater recreational activities (no data reported)
IndicatorsEPA State of the Environment Report Information from www, 7-16-02 • Water and Watersheds (A) What is the national condition of waters & watersheds? 1. Miles/acres of rivers & lakes meeting water quality designated use standards. 2. Water withdrawals (Heinz). 3. Altered fresh water ecosystems (Heinz). 4. Trophic status (NRC). 5. Harmful algal blooms (Heinz).
Indicators IIEPA State of the Environment Report Information from www, 7-16-02 • Water and Watersheds (B) What are the pressures on water quality? 1. Percent urban land cover in riparian areas. 2. Atmospheric deposition of nitrogen and mercury. 3. Sediment and pesticide runoff. 4. Contaminated sediment. 5. Water withdrawal (Heinz). 6. Toxic releases to water (TRI). 7. Nutrient runoff (NRC).
Indicators IIIEPA State of the Environment Report Information from www, 7-16-02 II. Wetlands What is the extent and condition of wetlands? 1. Freshwater wetland extent and change. 2. Coastal wetland extent and change. • Coastal Waters (A) What is the condition of coastal waters? 1. Water clarity. 2. Dissolved oxygen. 3. Sea surface temperature (Heinz).
Indicators IVEPA State of the Environment Report Information from www, 7-16-02 • Coastal Waters (B) What are the pressures on estuarine waters? 1. Atmospheric deposition of nitrogen. 2. Nitrogen runoff. 3. Toxic releases (TRI). 4. Coastal eutrophication. 5. Watershed export of nitrogen.
Indicators VEPA State of the Environment Report Information from www, 7-16-02 • Drinking Water (A) What is the quality of drinking water? 1. Trends in population served by water systems meeting all health standards. 2. Percent of assessed surface waters meeting designated drinking water standards. (B) What are the causes of drinking water contamination? To be developed. (C) What are the health effects of consuming contaminated drinking water? See Human Health Chapter.
Indicators VIEPA State of the Environment Report Information from www, 7-16-02 • Recreation In and On the Water (A) What is the condition of surface waters that support recreational use? Number of beach-days that beaches are open. (B) What are the sources of recreational water pollution? To be developed. (C) What are the health effects associated with recreation in contaminated water? See Human Health Chapter.
Indicators VIIEPA State of the Environment Report Information from www, 7-16-02 • Consumption of Fish & Shellfish (A) What is the condition of surface waters that support fish & shellfish consumption? 1. Fish tissue in coastal waters. 2. River miles and lake acres with fish advisories. 3. Waters meeting designated use for fish consumption. 4. Shellfish bed closures. 5. Watersheds exceeding water quality criteria for mercury, PCBs.
Indicators VIIIEPA State of the Environment Report Information from www, 7-16-02 • Consumption of Fish & Shellfish (B) What are the contaminants in fish and shellfish and where do they originate? To be developed. (C) What are the health effects of consuming contaminated fish and shellfish? See Human Health Chapter.
IndicatorsUSGS Circular 1223 Indicators of water availability include: Surface-water indicators: • Streamflow: annual, periodic, and long-term trends. • Reservoir storage, construction, sedimentation, removal. • Storage in large lakes, perennial snowfields, glaciers. Ground-water indicators: • Ground-water level indices re hydrogeologic environment and land-use setting. • Changes in ground-water storage re withdrawal, saltwater intrusion, mine dewatering, land drainage. • Number and capacity of supply wells and artificial recharge facilities.
Indicators IIUSGS Circular 1223 Indicators of water use include: • Total withdrawals by source (surface and ground water) and sector (public supply, domestic, commercial, irrigation, livestock, industrial, mining, thermoelectric power and hydropower). • Reclaimed wastewater. • Conveyance losses. • Consumptive uses.
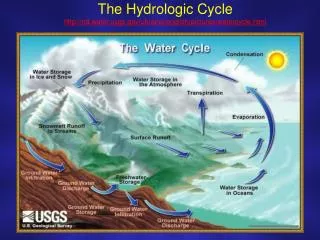
Indicators IIIUSGS Circular 1223 Water-Cycle Characterization: Water budget for a geographical area is (Water inflow)-(Water Outflow)=(Change in Water Storage). • Water Inflow: Precipitation, Surface-and-ground water inflow, Imported water. • Water Outflow: Evaporation, Evapotranspiration, Surface-and-ground water outflow, Exported water. • Change in Water Storage: Snowpack, Unsaturated Soil Zone, Streams, Rivers, Reservoirs, Aquifers.