Download
1 / 64
670 likes | 1.13k Views
Water Resources and Water Pollution. G. Tyler Miller, Jr.’s Environmental Science 10 th Edition Chapter 14. Key Concepts. Unique physical properties of water. Availability of fresh water. Using water more efficiently. Problems associated with flooding.

E N D
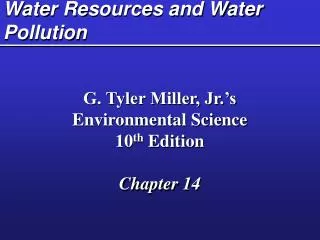
Water Resources and Water Pollution G. Tyler Miller, Jr.’s Environmental Science 10th Edition Chapter 14
Key Concepts • Unique physical properties of water • Availability of fresh water • Using water more efficiently • Problems associated with flooding • Types, sources, and effects of water pollutants • Pollution problems of surface and ground water • Reduction and prevention of water pollution • Sustainable use of water
Water Conflicts in the Middle East BLACK SEA GEORGIA AZERBAIJAN TURKMENISTAN TURKEY ARMENIA CASPIAN SEA MEDITERRANEAN SEA SYRIA LEBANON IRAN WEST BANK IRAQ GAZA JORDAN EGYPT OMAN KUWAIT SAUDI ARABIA Aswan BAHRAIN High Dam QATAR Lake Nasser UNITED ARAB EMIRATES SUDAN OMAN YEMEN SOMALIA ETHIOPIA • Water shortages- 10 countries share 3 rivers • Nile River • Jordan Basin • Tigris-Euphrates Fig. 14-1, p. 305
Water’s Unique Properties • Hydrogen bonding • Liquid over wide temperature range • Changes temperature slowly • High heat of evaporation • Great dissolving power • Filters out ultraviolet radiation • High surface tension and wetting ability • Expands when it freezes
Supply of Water Resources All water Fresh water Readily accessible fresh water (0.014%) Groundwater 0.592% Biota 0.0001% Rivers 0.0001% Lakes 0.007% 0.014% Fresh water 2.6% Oceans and saline lakes 97.4% Ice caps and glaciers 1.984% Atmospheric water vapor 0.001% Soil moisture 0.005% Fig. 14-2, p. 307
Surface Water • Surface runoff-precipitation that does not infiltrate or evaporate • Reliable runoff- available for human use(not lost by seasonal floods) • Watershed (drainage basin) -defined by topography
Groundwater- water that sinks into the soil and is stored in underground reservoirs • Zone of saturation- area where all pores in soil and rock are filled with water • Water table- located at the top of zone of saturation. Rises and falls seasonally • Aquifers- porous, water-saturated layers of sand, gravel or bedrock which groundwater flows • Natural recharge - natural replenishment of aquifer by precipitation percolating downward
Groundwater- Moves at about 1 meter per year Flowing artesian well Precipitation Evaporation and transpiration Well requiring a pump Evaporation Confined Recharge Area Runoff Aquifer Stream Infiltration Water table Lake Infiltration Unconfined aquifer Confined aquifer Less permeable material such as clay Confirming permeable rock layer Fig. 14-3, p. 308
Use of Water Resources • Humans use about 55% of reliable runoffProjected to increase, cause conflict • Agriculture- Uses 69% of world’s withdrawn water • Industry - Uses 23% of world’s withdrawn water • Domestic
Global Water Withdrawal (1900-2000) 5,500 5,000 Total use 4,500 4,000 3,500 3,000 Water use (cubic kilometers per year) 2,500 2,000 Agricultural use 1,500 Industrial use 1,000 Domestic use 500 1900 1920 1940 1960 1980 2000 Year Fig. 14-4, p. 309
Water Use in US and China United States China Agriculture 41% Agriculture 87% Power plant cooling 38% Public 6% Industry 7% Industry 11% Public 10% Fig. 14-5, p. 309
Amount of Water Needed to Produce Various Items 400,000 liters (106,000 gallons) 1 automobile 1 kilogram cotton 10,500 liters (2,400 gallons) 1 kilogram aluminum 9,000 liters (2,800 gallons) 1 kilogram grain-fed beef 7,000 liters (1,900 gallons) 1 kilogram rice 5,000 liters (1,300 gallons) 1 kilogram corn 1,500 liters (400 gallons) 1 kilogram paper 880 liters (230 gallons) Fig. 14-6, p. 309 220 liters (60 gallons) 1 kilogram steel US per capita water use = 1,280 gallons per person per day (1999)
Water Problems in the US • Shortages Average annual precipitation (centimeters) Less than 41 81-22 • Flooding More than 122 41-81 • Pollution Fig. 14-7a, p. 310
Water Stress & Scarcity • A country is water stressed when per capita availability falls below 60,000 ft3 per year (1 swimming pool = 9,000 ft3) • A country is water scarce when per capita availability falls below 35,000 ft3 per year • 500 million people live in water scarce countries • Projection: 2.4-3.4 billion people water scare or water stressed by 2050
4 Causes of Water Scarcity Acute shortage Adequate supply Shortage Metropolitan regions with population greater than 1 million • Dry climate • Drought 21 days w/ precip. below70% of normal • Desiccation from deforestation, overgrazing Fig. 14-7b, p. 310 • Water stresslow waterper person
Stress on World’s River Basins Europe North America Asia Africa South America Australia Stress High None Fig. 14-8, p. 311
Trade-offs of Dams and Reservoirs Downstream cropland and estuaries are deprived of nutrient-rich silt Flooded land destroys forests or cropland and displaces people Large losses of water through evaporation Downstream flooding is reduced Reservoir is useful for recreation and fishing Provides water for year-round irrigation of cropland Can produce cheap electricity (hydropower) Migration and spawning of some fish are disrupted Fig. 14-9 p. 312
• Deliver nutrients to the sea sustain coastal fisheries • Deposit silt that maintains deltas • Purify water • Renew and nourish wetlands • Provide habitats for aquatic life • Conserve species diversity Ecological Services of Rivers Fig. 14-10, p. 312
China’s Three Gorges Dam Advantages Disadvantages Floods large areas of cropland and forests Displaces 1.9 million people Increases water pollution because of reduced water flow Reduces deposits of nutrient-rich sediments below dam Increases saltwater introduced into drinking water near mouth of river because of decreased water flow Disrupts spawning and migration of some fish below dam High cost Generates 10% of China’s electricity Reduces dependence on coal Reduces air pollution Reduces CO2 emissions Reduces chances of downstream flooding for 15 million people Reduces river silting below dam by eroded soil Increases irrigation water for cropland below dam Trade-offs of China’s Three Gorges Dam Fig. 14-11, p. 313
Increasing Freshwater Supplies • Dams and reservoirs • Extracting groundwater • Desalination- expensive & what to do with salt? • **Reduce water waste***- 60-70% of world’s water is wasted: 50% USA • Import food rather than grow it • Import water • Catching precipitation
Aral Sea Disaster • Salinity • Fish extinctions and fishing • Wetland destruction and wildlife • Wind-blown salt • Water pollution • Climatic changes • Human health threats
Large-Scale Water Transfers And the Aral Sea Disaster KAZAKHSTAN 2000 1989 ARAL SEA 1960 UZBEKISTAN TURKMENISTAN Fig. 14-12, p. 313
California’s Water Problem • 75% of California’s population lives south of Sacramento • 75% of rain falls north of Sac. • Necessitates giant maze of dams, pumps and aqueducts - One of world’s largest transfer projects
Transferring Water from One Place to Another CALIFORNIA NEVADA UTAH Shasta Lake Sacramento River Sacramento North Bay Aqueduct San Francisco Fresno South Bay Aqueduct Colorado River Los Angeles Aqueduct ARIZONA California Aqueduct Central Arizona Project Los Angeles Phoenix San Diego Colorado River Aqueduct Tucson MEXICO • California Water Project Fig. 14-13, p. 314
Withdrawing Groundwater Advantages Disadvantages Trade-offs of Groundwater Use Aquifer depletion from overpumping Sinking of land (subsidence) when water removed Polluted aquifers unusable for decades or centuries Saltwater intrusion into drinking water supplies near coastal areas Reduced water flows into streams, lakes, estuaries, and wetlands Increased cost, energy use, and contamination from deeper wells Good source of water for drinking and irrigation Available year- round Exists almost everywhere Renewable if not overpumped or contaminated No evaporation losses Cheaper to extract than most surface waters Fig. 14-14, p. 315
Aquifer Depletion- aquifers provide 25% world’s drinking water: 51% USA Groundwater Overdrafts: Fig. 14-15a, p. 316 High Moderate Minor or none
Ground Subsidence from Overuse of Groundwater Subsidence: Fig. 14-15b, p. 316 High Moderate Minor or none
Saltwater Intrusion in Coastal Water Wells Major irrigation well Well contaminated with saltwater Water table Sea Level Salt water Fresh groundwater aquifer Interface Interface Fig. 14-16, p. 316 Saltwater Intrusion Normal Interface
Groundwater Depletion Prevention Control Waste less water Subsidize water conservation Ban new wells in aquifers near surface waters Buy and retire groundwater withdrawal rights in critical areas Do not grow water- intensive crops in dry areas Reduce birth rates Raise price of water to discourage waste Tax water pumped from wells near surface waters Set and enforce minimum stream flow levels Solutions to Prevent or Slow Groundwater Depletion Fig. 14-17, p. 316
WYOMING SOUTH DAKOTA Less than 61 meters (200 ft) 61-183 meters (200-600 ft) More than 183 meters (600 ft) (as much as 370 meters or 1,200 ft. in places) NEBRASKA KANSAS COLORADO OKLAHOMA NEW MEXICO TEXAS Miles 0 100 0 160 Kilometers Depletion of the Ogallala Aquifer Saturated thickness of aquifer Fig. 14-18, p. 317
Converting Salt Water to Fresh Water, Cloud Seeding, and Iceberg Towing • Distillation desalination • Reverse osmosis desalination • Problems with desalination • Cloud seeding • Iceberg towing
Reducing Water Waste • Benefits of water conservation • Reduce leakage and save water • Government subsidies and waste • Improve irrigation • Using less water in homes and businesses • Xeriscaping
Major Irrigation Systems Gravity Flow (efficiency 60% and 80% with surge valves) Water usually comes from an aqueduct system or a nearby river. Drip Irrigation (efficiency 90-95%) Above- or below-ground pipes or tubes deliver water to individual plant roots. Center Pivot (efficiency 80% with low-pressure sprinkler and 90–95% with LEPA sprinkler) Water usually pumped from underground and sprayed from mobile boom with sprinklers. Fig. 14-19, p. 319
Lining canals bringing water to irrigation ditches • Leveling fields with lasers • Irrigating at night to reduce evaporation • Using soil and satellite sensors and computer systems to monitor soil moisture and add water only when necessary • Polyculture • Organic farming • Growing water-efficient crops using drought-resistant and salt-tolerant crop varieties • Irrigating with treated urban waste water • Importing water-intensive crops and meat Reducing Waste in Irrigation Fig. 14-20, p. 319
• Redesign manufacturing processes • Landscape yards with plants that require little water • Use drip irrigation • Fix water leaks • Use water meters and charge for all municipal water use • Raise water prices • Require water conservation in water-short cities • Use water-saving toilets, showerheads, and front- loading clothes washers • Collect and reuse household water to irrigate lawns and nonedible plants • Purify and reuse water for houses, apartments, and office buildings Reducing Water Waste in Industries, Homes, and Businesses Fig. 14-21, p. 320
Xeriscaping Fig. 14-22, p. 320
Too Much Water: Floods • Living on floodplains • Natural phenomena aggravated by human activities Reservoir Dam Levee Flood wall Floodplain Fig. 14-23, p. 322
Benefits of Floodplains • Highly productive wetlands • Fertile soils • Nearby rivers for use and recreation • Flatlands for structures
Dangers of Floodplains and Floods • Deadly and destructive floods • Human activities worsen floods • Failing dams and water diversion • Bangladesh
Before Deforestation Oxygen released by vegetation Diverse ecological habitat Evapotranspiration Trees reduce soil erosion from heavy rain and wind Agricultural land Steady river flow Leaf litter improves soil fertility Tree roots stabilize soil and aid water flow Vegetation releases water slowly and reduces flooding Fig. 14-24a, p. 322 Forested Hillside
Disastrous Effects of Slope Deforestation Tree plantation Evapotranspiration decreases Roads destabilize hillsides Ranching accelerates soil erosion by water and wind Winds remove fragile topsoil Agriculture land is flooded and silted up Gullies and landslides Heavy rain leaches nutrients from soil and erodes topsoil Rapid runoff causes flooding Silt from erosion blocks rivers and reservoirs and causes flooding downstream Fig. 14-24b, p. 322 After Deforestation
Reducing Flood Risks • Channelization • Levees • Dams • Identify and manage flood-prone areas
Flood-prone Areas Extremely severe Very severe Moderately severe Fig. 14-25, p. 323 Somewhat severe Not severe
Pollution of Streams • Oxygen sag curve • Factors influencing recovery Fig. 14-27, p. 326
Lake Pollution • Stratification in lakes • Lack of water flow • Biomagnification of contaminants • Cultural eutrophication
Biological Magnification of PCBs Water 0.000002 ppm Phytoplankton 0.0025 ppm Herring gull 124 ppm Herring gull eggs 124 ppm Zooplankton 0.123ppm Lake trout 4.83 ppm Fig. 14-28, p. 328 Rainbow smelt 1.04 ppm
Lake Pollution Cultural Eutrophication Fig. 14-29, p. 329
Groundwater Pollution: Causes and Persistence • Low flow rates • Few bacteria • Low oxygen • Cold temperatures Hazardous waste injection well Pesticides Coal strip mine runoff De-icing road salt Buried gasoline and solvent tank Cesspool septic tank Pumping well Gasoline station Waste lagoon Water pumping well Sewer Landfill Leakage from faulty casing Accidental spills Discharge Unconfined freshwater aquifer Confined aquifer Confined freshwater aquifer Groundwater flow Fig. 14-31, p. 331
Protecting Groundwater Resources • Groundwater is difficult to clean • Prevention is the answer • Groundwater monitoring • Leak detection systems • Ban underground disposal of hazardous wastes • Carefully store hazardous wastes above ground
Aquatic Systems & Their Pollution Vulnerability Approx. Flush/Cleaning Time Aquatic Ecosystem D.O. Replacement Streams Days to weeks Fast Lakes 1-100 years Slower 100s – 1000s of years for degradable waste Groundwater Slowest Ocean – Deep water ocean areas can dilute, disperse, and degrade large amounts of pollutants