Homework
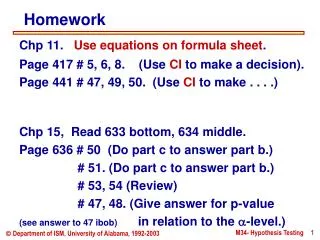
Homework. Chp 11. Use equations on formula sheet . Page 417 # 5, 6, 8. (Use CI to make a decision). Page 441 # 47, 49, 50. (Use CI to make . . . .). Chp 15, Read 633 bottom, 634 middle. Page 636 # 50 (Do part c to answer part b.)

Homework
E N D
Presentation Transcript
Homework Chp 11. Use equations on formula sheet.Page 417 # 5, 6, 8. (Use CI to make a decision). Page 441 # 47, 49, 50. (Use CI to make . . . .) Chp 15, Read 633 bottom, 634 middle.Page 636 # 50 (Do part c to answer part b.) # 51. (Do part c to answer part b.) # 53, 54 (Review) # 47, 48. (Give answer for p-value(see answer to 47 ibob) in relation to the a-level.)
Lesson Objectives • Understand the “types of errors” in decision making. • Know what the a-level means. • Learn how to use “p-values” andconfidence intervals for decisionmaking.
Court case Hypothesis: Defendant is innocent. Alternative: Defendant is guilty. Decisions: Based on the sample data. Persongoes tojail! Reject Innocence Declare“Guilty” Person goes free! Do not Reject Innocence Declare“Not Guilty”
Types of Errors in a court case Type I: Sending an innocent person to jail. Type II: Letting a guilty person go free. a = level of risk deemed reasonablefor the occurrence of a Type I error. = the point of “reasonable doubt.”
Types of Errors, in general Type I: Concluding that the hypothesized parameter value is wrong, but in reality it is correct. Type II: Not concluding that the hypothesized parameter value is wrong, but in reality it is incorrect. a = level of risk, chosen by the user,for allowing a Type I error to occur. b = risk for making Type II error.
Potato Chip Inspection by FDA • Net weight of potato chip bagsshould be 16.00 oz. • An FDA inspector will take a random sample of 36 bags. If the net weight is too low, the chip company will be fined substantially. • From the FDA perspective, what would the Type I and Type IIerrors be (in words)?
Potato Chips; types of errors Type I: Penalizing the potato chip company when in reality they were NOT cheating the consumer. Type II: Not detecting that the potato chip company was cheating the consumers, when in reality theywere. Which is more serious, from the FDA’s perspective?
Selecting an a-level Chose an a-level that considers the consequences of the Type I and Type II errors. a and b are inversely related;as one goes up, the other goes down, but NOT by equal amounts.
Statistical Inference Methods: Reject the hypothesized value if: • it is outside the confidence interval. • the p-value is less than the user specified a-level. (p-value < a-level) • the calculated test statistic valueis in the “critical region.” Three methods; each should give the same result.
Decisions are based on the data.Wrong decisions are the result of chance, not mistakes.
Desireda-level: Size ofCI to use: (1-a)100% Confidence Interval Method Hypothesized mean: 40.0 Two tailed test;“Is the mean something other than 40.0?” a 1 - a .10 .90 .05 .95 .01 .99 Result: Each tail has half of a. One tail test;“Is the mean something greater than 40.0?” or “Is the mean something less than 40.0?” a 1 - 2a .10 .80 .05 .90 .01 .98 Result:Each tail has the full a-level. Use only ONEtail for making a decision.
p-Value Method The probability of observing a future statistic value that is as big ormore extreme, in the direction(s) of interest,than the value we just observed,assuming that the hypothesized value is the correct parameter. Calculate p-value using the most appropriate distribution. Decision rule: If p-value < a-level, reject the hypothesized value.
2.6 2.6 p-Value: Hypo. mean: 40.0, X = 42.6 Two tailed test;“Is the mean something other than 40.0?” p-value/2 p-value/2 40 X 42.6 37.4 Upper tail test;“Is the mean something greater than 40.0?” p-value 40 42.6 X p-value Lower tail test;“Is the mean something less than 40.0?” 40 42.6 X
Problem 1, using p-Value Pick a = .05 Hypothesized mean: 40.0. Adjust machine if it’s offin either direction. .5000 .4332 .0668 Also more extreme More extreme than 3.0 units than 3.0 units Sample results:X = 43.0s = 7.2 40 X 43.0 What distributionshould be used? -1.50 0 Z 1.50 p-value = .0668 •2 = .1336 43.0 – 40.0 2.0 = 1.50 Z = (p-value=.1336) > (a=.05);do not reject 40.0.
s n X ± Za/2 Problem 1 with Confidence Interval Pick a = .05 Hypothesized mean: 40.0. Adjust machine if it’s offin either direction. 43.0± 1.96 2.0 43.0 ± 4.92 Sample results:X = 43.0s = 7.2 (38.08, 47.92) What distributionshould be used? 40.0 falls inside the C.I.; do not reject 40.0.
Problem 2, using p-Value Pick a = .05 Hypothesized mean: 40.0. FDA will fine companyif the mean is lower. From Excel, .0320 More extreme than 3.6 units below. Sample results:X = 36.4s = 7.2 40 X 36.4 What distributionshould be used? -2.00 0 t From the t-table . . . . more than .025, less than .050. 36.4 – 40.0 7.2 / 4 p-value =. = -2.00 t = (p-value =.0320) < (a-level = .05); reject 40.0.
s n X ± t.05, 15 7.2 16 36.4± 1.753 Problem 2 with Confidence Interval Pick a = .05 Hypothesized mean: 40.0. FDA will fine companyif the mean is lower. Sample results:X = 36.4s = 7.2 36.4 ± 3.1554 What distributionshould be used? (33.245, 39.555) 40.0 falls outside the C.I.;reject 40.0.
Does a person have ESP? Experiment: • Two people in different rooms. • “A” is shown one of five cards, selected randomly. “A” transmits his thoughts. • “B” selects the card he thinks is beingsent to him, and records it • The process is repeated 20 times; the cards are shuffled each time. X = a count of the number correct.X ~ Bino(n=20, p =.20)
X = a count of the number correct.X ~ Bino(n=20, p =.20) m = np = 4.0 (Cannot use Normal approx.) a-level = .05 Hypothesized value: p = .20, Data: “B” got 9 out 20 correct.Does “B” do better than guessing? Use Binomial Dist. Bino(20, 0.20) p-value = P(X >= 9) = 1 – P(X <= 8) = 1 – .9900 = .0100 Use Table A.2 Reject .20; she does better!