Download
1 / 14
140 likes | 168 Views
Learn about the impact of climate change on forest fires in Canada, including key statistics, causes, carbon release, and anticipated changes. Explore adaptation strategies and ongoing research efforts.

E N D
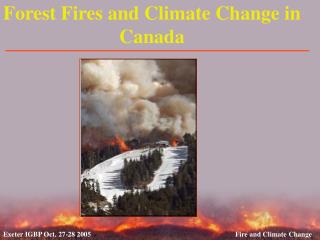
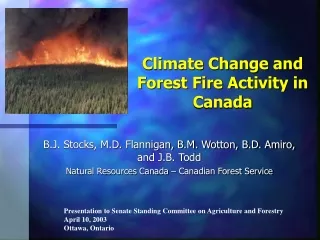
Climate Change and Forest Fire Activity in Canada B.J. Stocks, M.D. Flannigan, B.M. Wotton, B.D. Amiro, and J.B. Todd Natural Resources Canada – Canadian Forest Service Presentation to Senate Standing Committee on Agriculture and Forestry April 10, 2003 Ottawa, Ontario
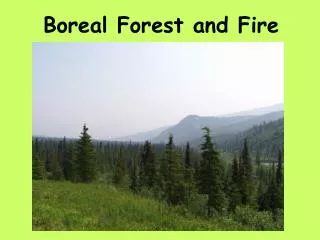
Circumboreal Forest Fire Activity • Annual burned area: 5-15 million hectares • Primarily Canada, Russia and Alaska • Russian stats underestimated – should be 5 to 10 times higher • Area burned shows great inter-annual variability • Continental climate, extreme weather/fire danger conditions, multiple ignitions, and closed canopy forests are main drivers of boreal fire activity
Boreal Fire Importance/Characteristics • Dominant disturbance regime, natural & essential to ecosystem maintenance, C cycling, biodiversity • Sensitive to climate change – major carbon budget implications - 40% of terrestrial C in boreal zone • High fuel consumption, fast spread rates, sustained high intensity levels, towering convection columns (upper troposphere) with long-range smoke transport potential
Canadian Fire Statistics • Incomplete prior to 1970 • < certainty further back in time • Now 8000 fires, 2.8 million ha/yr • $500 million annually • Area burned is highly episodic • 0.7 to 7.6 million ha • Level of protection issue • Protect resources vs natural fire • Lightning fires • 35% of total fires /85% AB • Fire size • 3% of fires are >200 ha (used in Large Fire Database) • Remainder suppressed early • Represent 97% of area burned
Large Fire Database (LFDB) • Fires >200 ha post-1950 nationally • Polygons with attributes (fire size, cause, start and end dates etc.) from fire management agencies • 1980s fires in central Canada illustrated • Updated annually – working back in time with satellite imagery
Lightning/Human-Caused Fires • Most lightning fires in north, H-C along travel corridors • Generally lightning fires grow larger – detection/access issue • Lightning fire contribution to area burned increasing in recent decades
Actioned/Non-Actioned Fires • Many fires allowed to burn naturally, mainly in north • Management decision based on values-at-risk • Constitutes ~50% of area burned in Canada post-1959
LFDB Fire Size Distribution by Ecozone Greatest area burned in boreal and taiga zones of west-central Canada where unsuppressed fire is common and fire climate most severe Larger size-class fires, although less frequent, account for most of area burned
Carbon Release Through Fire • Direct release to atmosphere averages 27 Tg C/yr (20% of Canada’s fossil fuel emissions) - preliminary estimate - need further severity/decomposition work • Younger forests weaker C sinks than mature forests • Takes 20-30 years to fully recover after fire (confirmed from flux tower, aircraft and satellite measurements)
Disturbances and the Carbon Budget 10 8 6 Area (Million ha) 4 2 400 Note change after 1970 0 Sink 1920 1940 1960 1980 2000 300 200 100 Tg C / yr ClearCut Fire Insects Total 0 -100 Source -200 1920 1940 1960 1980 2000 Variable Temp Constant Temp Note rise in natural disturbances (fire and insects) post 1970 Corresponding decrease in C sink strength of CDN forest post-1970
Anticipated Changes in Seasonal Fire Danger and Fire Season Length Fire season length increases by 10 to 50 days by 2090 Seasonal fire danger increases by 50-100% by 2090
Anticipated Fire Impacts • Increase in weather conditions conducive to fires • More frequent and severe fire activity • Projected impacts: • More area burned, shorter fire return intervals • Younger age class structure • Ecosystem boundary/vegetation shifting • Less terrestrial C storage • Impacts on forest industry/communities • Health/pollution issues • Positive feedback to climate change (>GHG emissions) • Need to quantify impacts in order to assess options • Adaptation will be required • Ongoing CFS climate change/fire research addressing impacts and adaptation in collaboration with provinces/territories • Funding through Green Plan, Climate Change Action Fund, Action Plan 2000 and CRAs with provinces
Adapting to Increasing Fire Activity • Local scale: • Community protection (FIRESMART) • Regional scale: • Pilot fuelbreaks project – break up fuel continuity to limit fire effects on fiber production • Level of protection effectiveness studies – cost of maintaining status quo with increasing risk, protect less and permit more natural fire • National scale: • Cannot mitigate fire impacts across whole boreal forest • Adapt based on values-at-risk • Evaluate the impacts of an increased fire regime for policy-makers