Unlocking Ecosystem Service Payments: Valuing Nature’s Contributions in Tanzania
This document explores the mechanisms and markets for Ecosystem Service Payments (ESPs), focusing on Tanzania's approach to valuing nature. It discusses various types of PES, including private deals, public payments, and trading of environmental credits. The text highlights the essential role of forests, water, and biodiversity in mitigating climate change and emphasizes innovative financial solutions like carbon credits, biodiversity offsets, and watershed conservation. Understanding these frameworks enables better implementation of practices that protect ecosystems while providing economic incentives to landowners.

Unlocking Ecosystem Service Payments: Valuing Nature’s Contributions in Tanzania
E N D
Presentation Transcript
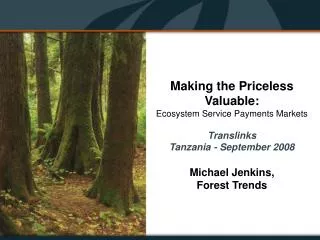
Making the Priceless Valuable: Ecosystem Service Payments MarketsTranslinksTanzania - September 2008Michael Jenkins, Forest Trends
Markets in Transition - Ecosystems Services Revenue Services Certified Timber BotanicalsWastewood Utilization Trees Carbon Credits –Reforestation/AfforestationBiofuelsConservation Carbon Carbon Pharmaceuticals/Natural Medicine Personal Care/ Cosmetics Biodiversity Eco-tourism Protection Biodiversity Credits & Offsets Conservation Watershed Conservation &Restoration User FeesMitigationSalinity Credits
New Finance: Payments for Ecosystem Services • Types of PES: • Self-organized private dealsPrivate entities pay for private services • Public payments to private land and forest owners Public agency pays for service • ‘Cap and Trade’ - trading of environmental credits under a cap or floor Landowners either comply directly with regulations, or buy compliance credits • Eco-labelling of agricultural and tree products Consumers prefer certified sustainable supplies
CCX 23 Mt 72 M CDM 791 Mt $ 15 Billion EU ETS Vol: 2,061Mt (CO2e) Value: $50 Billion CARBON: Carbon Markets Voluntary OTC 42 Mt $258 M JI41 Mt $495 M NSW GGAS 25 Mt $224 M 5 5 5 Source: New Forests/Ecosystem Marketplace, World Bank
CARBON: Growth of Carbon Markets Carbon Market Transaction Volumes and Values, 2006 and 2007 Markets VOL. (MtCO2e) VALUE (US$mill)2006 2007 2006 2007 Voluntary OTC Market 14.3 42.1 58.5 258.4 Chicago Climate Exchange (CCX) 10.3 22.9 38.3 72.4 Total Voluntary Markets24.6 65.0 96.7 330.8 EU-ETS 1,1044 2,061 24,436 50,097 Primary CDM 537 551 6,887 6,887 Secondary CDM 25 240 8,384 8,384 Joint Implementation 16 41 141 495 New South Wales 20 25 225 224 Total Regulated Markets1,702 2,918 40,072 66,087 TOTAL GLOBAL MARKET1,727 2,983 40,169 66,417 Sources: Ecosystems Marketplace, New Carbon Finance, World Bank OTC = Over the Counter
CARBON: Forest Carbon in the Voluntary Market • Forest carbon is < 1% of total market since effectively excluded from regulatory markets (high transaction costs in CDM) • Forest carbon composed ~20% volume of Voluntary Market • Voluntary carbon prices are increasing – for OTC trades from $1.80/tCO2e in 2006 to $3 in 2007. Forest carbon prices are above average: $7-8 for afforestation and $4.8 for AD projects • Voluntary market allows innovation, e.g., development of methodologies and standards for REDD; ‘gourmet carbon’ combines carbon and equity objectives • Key role of standards to ensure quality and reassure buyers, e.g., combination of CCB and VCS standards
Potential of Avoided Deforestation or REDD • Stern Review (2006): deforestation contributes about a fifth of CO2 emissions – he said avoided deforestation (AD) should be one of four key elements of global climate change mitigation strategy. • Stern also said AD is a “highly cost-effective way of reducing greenhouse gas emissions” due to (often) low land-use opportunity costs • REDD will have major co-benefits: biodiversity, water and (perhaps) equity • Bali CoP 2007 committed to “urgent and meaningful action on REDD” – need to define REDD mechanism for post-Kyoto regime (2013-2017) at Copenhagen Source: Stern, 2006
But REDD is Complex - Challenges • Baselines are difficult due to future uncertainty • Ex-post payments but up-front costs: how to fund ‘Readiness’, e.g., baselines, REDD planning, national carbon infrastructure, etc. • National strategy is vital due to leakage, but so is a project approach involving private sector investment – ‘nested approach’ • Equity concerns, e.g., compensating the ‘bad guys’; community conservation has potential, but ‘additionality’ and transaction costs (role for ODA/philanphropy finance?) • Deforestation is highest where governance is worst
WATER: Payments for Watershed Services • Demand for clean water is increasing rapidly: water use has increased at twice the population rate. 40% of cities depend on forest areas for water. • Investment in watershed management is cheaper than treatment or obtaining new water supplies. In the US, each $1 in watershed protection saved $7-200 in filtration/water treatment. • Payments of upstream watershed protection is already taking place in New York City as well as several countries (e.g., Mexico, Costa Rica, Ecuador)
WATER:The “Dead Zone” Problem Source: New Scientist
WATER: Payments for Watershed Services - Types Nutrient Trading: Is essentially cap-and-trade applied to watersheds - Those who pollute more buy from those who pollute less. • Ex. Chesapeake, Gulf of Mexico, • Yellow River (China) • Upstream Watershed Protection: • Ex. Mexico, Costa Rica, Ecuador • Other: • Flood Control • Salinity Control
WATER: The Benefit of Forested Watersheds on Quality • Provide food, habitat, and temperature control for stream communities • Stabilize streambanks and control sediment flux by holding the soil in place • Filter pollutants by removing suspended solids from surface runoff • Function as a sink by taking up and sequestering nutrients in plant tissue
WATER: The Chesapeake Fund • Goal: attract new capital and maximize return of restoration investments • Collaborative project: Forest Trends, Chesapeake Bay Foundation, and World Resources Institute • Regional pilot with the potential to scale and model in other watersheds • Focus on “offsetting” nitrogen emissions by investing in water quality protection and restoration projects • Forest restoration and protection: potential for high-value return
BIODIVERSITY: Biodiversity Markets • Not easily commoditized • Is an “anti-commodity” • Wetland Banking • Conservation Banking • Voluntary Biod. offsets • Gov’t payments for biodiversity • Such as Bush Tender, Eco-Tender in Australia • Program in Mexico
BIODIVERSITY: Biodiversity Markets Environmental Mitigation: Largest Biodiversity Offset Market in the U.S. • $3.3 billion a year spent on mitigation in the U.S. • $2 billion in mitigation parcel purchases • $1.3 billion sold from the roughly 120 species banks and 600 wetland banks in the US • Credits sell from $4,000 to $450,000 an acre • Banks are usually 30 to 400 acres (some as big as 1500) • Can be profitable, a known bank started selling credits for $1,500 and 10 years later they were selling for $125,000 - due to demand and ambient land value • The industry is ~20 years old and is growing steadily
BIODIVERSITY: Biodiversity Markets – Forest Landholders • Forest landowners have the advantage of already owning the land. This is the big expense in selling mitigation credits. • Forestry Opportunity: generate income from existing conservation parcels generate mitigation for internal permitting • Sectors involved: • Forestry (International Paper, Weyerhaeuser) • Mining & Minerals (Rio Tinto, Vulcan) • Oil & Gas (Chevron, Shell) • Electric Utilities (Southern California Edison, EPRI) • Finance (Bank of America)
Financing: Driving Sustainability into Natural Resource Management - A New Business Model for Forest Land Owners ROI, Shareholder Value, Ratings, Capital Timber Activities Sales, Profit, Pricing, Margins Tangible Value Drivers Intangible Value Drivers • Reputation (PR, Brand) • Stakeholder Licence to Operate • protection of asset • stakeholder & local community relations • Innovation • Talent Attraction & Retention • Biodiversity/Natural Capital Non Timber Activities Watershed Credits Carbon Credits Conservation Credits Recreation Extractive Other New Revenue Streams Cost Efficiency Risk Management Asset Value – Land Appreciation Diversity of Income Streams(minimized cyclicality)
More Finance from PES … But Big Challenges Remain • Need to tackle policy, market and governance failures, e.g., illegal logging, weak property rights, weak compliance, etc. These cause high opportunity costs so SFM can’t compete with alternative land uses – so the challenge is forest finance AND incentives • Challenges of REDD, e.g., start-up costs, government capacity, equity, nested approach, etc. – needs multiple financing and partnerships • The adaptation challenge – can we combine mitigation with adaptation? • How to combine equity and environmental objectives (trade-offs between these objectives have been more common in the past) • Global food and energy needs versus environment
Roles for ODA and/or philanthropy finance Promoting an enabling regulatory and governance environment, including monitoring FLEG and secure property rights Capacity building for PES: new institutions dedicated to PES (e.g. FONAFIFO), national certifiers/verifiers, carbon registries, business development services for PES, etc. Ensuring equity: subsidising transaction costs, promoting secure tenure, SMFE finance, collective institutions for PES, etc. Venture capital role - up-front investment for innovative PES mechanisms to leverage other private sector investors
Roles for ODA and/or philanthropy finance Tackling risk constraints to new instruments, e.g., innovative approaches to insurance and re-insurance ‘Product development’ role: pilot projects to develop new approaches, method-ologies, metrics, standards, etc. with communities/low income forest people Facilitating information flows on new markets – PES, forest investors, technical assistance, etc. 8. Catalysing collaboration between donors, i.e. CPF members, UNFF-UNFCC, Millennium Development Goal programs