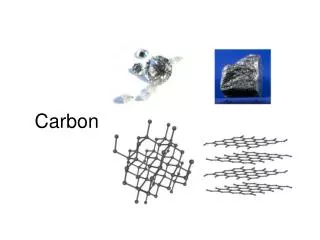
Carbon
320 likes | 491 Views
Budget09 released on 21 November 2010 ppt version 20 January 2011. Carbon. Budget. 2009. GCP-Carbon Budget2009 Contributors. Peter E. Levy Centre for Ecology and Hydrology, Bush Estate, Penicuik, UK Sam Levis National Centre for Atmospheric Research, Boulder, Co, USA Mark R. Lomas

Carbon
E N D
Presentation Transcript
Budget09 released on 21 November 2010 ppt version 20 January 2011 Carbon Budget 2009
GCP-Carbon Budget2009 Contributors Peter E. Levy Centre for Ecology and Hydrology, Bush Estate, Penicuik, UK Sam Levis National Centre for Atmospheric Research, Boulder, Co, USA Mark R. Lomas Department of Animal and Plant Sciences, University of Sheffield, U Joseph MajkutAOS Program, Princeton University, Princeton, New Jersey, USA Nicolas Metzl LOCEAN-IPSL, CNRS, Institut Pierre Simon Laplace, Université Pierre et Marie Curie, Paris, France Corinne Le QuéréSchool of Environment Sciences, University of East Anglia, Norwich, UK British Antarctic Survey, Cambridge, UK Andrew Lenton CSIRO Marine and Atmospheric Research, Tasmania, Australia Ivan Lima Woods Hole Oceanographic Institution, Woods Hole, Massachusetts, USA Gregg MarlandCarbon Dioxide Information Analysis Center, Oak Ridge National Laboratory, Oak Ridge, Tennessee, USA Glen P. PetersCenter for International Climate and Environmental Research, Oslo, NorwayMichael R. RaupachGlobal Carbon Project, CSIRO Marine and Atmospheric Research, Canberra, Australia Stephen SitchSchool of Geography, University of Leeds, Leeds, UK James T. Randerson Department of Earth System Science, University of California, Irvine, California, USA Guido R. van der Werf Faculty of Earth and Life Sciences, VU University, Amsterdam, The Netherlands Nicolas ViovyLaboratoire des Sciences du Climat et de l’Environnement, CEA-CNRS-UVSQ, FranceF. Ian WoodwardDepartment of Animal and Plant Sciences, University of Sheffield, Sheffield, UK Sönke Zaehle Max-Planck Institute for Biogeochemistry, Jena, Germany Ning Zeng University of Maryland, College Park, MD, USA Karen Assmann University of Bergen, Norway Thomas A. Boden Carbon Dioxide Information Analysis Center, Oak Ridge National Laboratory, Oak Ridge, Tennessee USA Gordon Bonan National Centre for Atmospheric Research, Boulder, CO, USA Laurent BoppLaboratoire des Sciences du Climat et de l’Environnement, UMR, CEA-CNRS-UVSQ, France Erik Buitenhuis School of Environment Sciences, University of East Anglia, Norwich, UK Ken Caldeira Depart. of Global Ecology, Carnegie Institution of Washington, Stanford, USA Josep G. CanadellGlobal Carbon Project, CSIRO Marine and Atmospheric Research, Canberra, Australia Philippe CiaisLaboratoire des Sciences du Climat et de l’Environnement, UMR CEA-CNRS-UVSQ, France Thomas J. ConwayNOAA Earth System Research Laboratory, Boulder, Colorado, USA Steve Davis Depart. of Global Ecology, Carnegie Institution of Washington, Stanford, USA Scott C. DoneyWoods Hole Oceanographic Institution, Woods Hole, Massachusetts, USA Richard A. FeelyPacific Marine Environmental Laboratory, Seattle, Washington, USA Pru FosterQUEST, Department of Earth Sciences, University of Bristol, UK Pierre Friedlingstein Laboratoire des Sciences du Climat et de l’Environnement, FranceQUEST, Department of Earth Sciences, University of Bristol, UK Joe L. Hackler Woods Hole Research Center, Falmouth, Massachusetts, USA Christoph Heinze University of Bergen, Norway Richard A. Houghton Woods Hole Research Center, Falmouth, Massachusetts, USA Chris HuntingfordCentre for Ecology and Hydrology, Benson Lane, Wallingford, UK
GCP-Carbon Budget2009 http://www.globalcarbonproject.org/carbonbudget Friedlingstein P, Houghton RA, Marland G, Hackler J, Boden TA, Conway TJ, Canadell JG, Raupach MR, Ciais P, Le QuéréC.Update on CO2 emissions. Nature Geoscience, DOI 10.1038/ngeo_1022, Online 21 November 2010. http://www.nature.com/ngeo/journal/vaop/ncurrent/full/ngeo1022.html
1 Pg = 1 Petagram = 1x10¹⁵g = 1 Billion metric tons = 1 Gigaton 1 Tg = 1 Teragram = 1x10¹²g = 1 Million metric tons 1 Kg Carbon (C) = 3.67 Kg Carbon Dioxide (CO2) Units
Growth rate 2000-2009 2.5 % per year CO2 emissions (Pg C y-1) CO2 emissions (Pg CO2 y-1) Growth rate 1990-1999 1 % per year Time (y) Fossil Fuel CO2 Emissions 2009: Emissions:8.4±0.5 PgC Growth rate: -1.3% 1990 level: +37% 2000-2008 Growth rate: +3.2% 2010 (projected): Growth rate: >3% Friedlingstein et al. 2010, Nature Geoscience; Gregg Marland, Thomas Boden-CDIAC 2010
2009 2000 China 1600 USA 1200 Carbon Emissions per year (C tons x 1,000,000) 800 India Russian Fed. 400 Japan 0 93 97 99 03 05 1990 95 2001 2009 07 Time (y) Fossil Fuel CO2 Emissions: Top Emitters Global Carbon Project 2010; Data: Gregg Marland, Tom Boden-CDIAC 2010
2009 160 UK Canada 120 Carbon Emissions per year (C tons x 1,000,000) Australia 80 Spain The Netherlands 40 Denmark 0 07 93 97 99 03 05 1990 95 01 2009 Time (y) Fossil Fuel CO2 Emissions: Profile Examples Global Carbon Project 2010; Data: Gregg Marland, Tom Boden- CDIAC 2010
5 57% Annex B (Kyoto Protocol) Developed Nation 4 CO2 emissions (PgC y-1) 3 43% Developing Nations Non-Annex B 2 2000 2010 1990 Time (y) Fossil Fuel CO2 Emissions Updated from Le Quéré et al. 2009, Nature Geoscience; CDIAC 20010
Top 20 CO2 Emitters & Per Capita Emissions 2009 6 2500 5 2000 4 1500 Per Capita Emissions(tons C person y-1) Total Carbon Emissions (tons x 1,000,000) 3 1000 2 500 1 0 0 USA IRAN INDIA ITALY CHINA SPAIN BRAZIL JAPAN RUSSIA MEXICO POLAND CANADA GERMANY AUSTRALIA INDONESIA SAUDI ARABIA SOUTH KOREA SOUTH AFRICA UNITED KINGDOM FRANCE (inl. Monaco) Global Carbon Project 2010; Data: Gregg Marland, Thomas Boden-CDIAC 2010; Population World Bank 2010
4 40% Oil 3 36% Coal CO2 emissions (PgC y-1) 2 Gas 1 Cement 0 2000 2010 1990 Time (y) CO2 Emissions by Fossil Fuel Type Updated from Le Quéré et al. 2009, Nature Geoscience; Data: Gregg Marland, Thomas Boden-CDIAC 2010
350 300 92% of growth 250 200 CO2 emissions (Tg C y-1) 150 100 50 0 India World China US -50 Change in CO2 Emissions from Coal (2007 to 2009) Global Carbon Project 2010; Data: Gregg Marland, Thomas Boden-CDIAC 2010
10 Observed Projected A1B Models Average 9 A1FI Models Average A1T Models Average A2 Models Average 8 B1 Models Average B2 Models Average Fossil Fuel Emission(PgCy-1) Full range of IPCC individual scenarios used for climate projections 7 6 5 1990 1995 2000 2005 2010 2015 Time (y) Fossil Fuel Emissions: Actual vs. IPCC Scenarios Updated from Raupach et al. 2007, PNAS; Data: Gregg Marland, Thomas Boden-CDIAC 2010;International Monetary Fund 2010
Year 2004 From dominant net exporting countries (blue) to dominant net importing countries (red). Fluxes of Emissions Embodied in Trade (Mt CO2 y-1) Davis & Caldeira 2010, PNAS; See also Peters & Hertwich 2008, Environ, Sci & Tech.
10 8 Fossil fuel 6 CO2 emissions (PgC y-1) 4 Land use change 2 1970 1980 2010 2000 1960 1990 Time (y) CO2 Emissions from FF and LUC (1960-2009) LUC emissions now ~10% of total CO2 emissions Updated from Le Quéré et al. 2009, Nature Geoscience
1990-1999 1.5±0.7 PgCy-1 2000-2009 1.1±0.7 PgCy-1 CO2 emissions (PgC y-1) CO2 emissions (PgCO2 y-1) CO2 Emissions from Land Use Change 1990s Emissions: 1.5±0.7 PgC 2000-2005 Emissions: 1.3±0.7 PgC 2006-2010: Emissions: 0.9±0.7 PgC Time (y) Friedlingstein et al. 2010, Nature Geoscience; Data: RA Houghton, GFRA 2010
1800 1600 Tropical 1400 1200 Temperate 1000 800 CO2 emissions (TgC y-1) 600 400 200 0 -200 -400 1850 1860 1870 1880 1890 1900 1910 1920 1930 1940 1950 1960 1970 1980 1990 2000 2010 Time (y) Emissions from Land Use Change (1850-2009) R.A. Houghton 2010, personal communication; GFRA 2010
1000 Latin America 800 S & SE Asia Tropical Africa 600 400 CO2 emissions (Tg C y-1) 200 0 -200 1850 1860 1870 1880 1890 1900 1910 1920 1930 1940 1950 1960 1970 1980 1990 2000 2010 Time (y) Emissions from Land Use Change (1850-2009) R.A. Houghton 2010, personal communication; GFRA 2010
Global Fire Emissions Database (GFED) version 3.1 1400 1200 1000 Fire Emissions from deforestation zones(Tg C y-1) America 800 Africa Asia 600 Pan-tropics 400 200 0 01 99 1997 07 05 2003 2009 Time (y) Fire Emissions from Deforestation Zones van der Werf et al. 2010, Atmospheric Chemistry and Physics Discussions
390 388 386 Parts Per Million (ppm) 384 382 380 378 • 1970 – 1979: 1.3 ppm y-1 1980 – 1989: 1.6 ppm y1 • 1990 – 1999: 1.5 ppm y-1 2000 - 2009: 1.9 ppm y-1 2006 2009 2008 2011 2007 2010 Atmospheric CO2 Concentration GLOBAL MONTHLY MEAN CO2 December 2009: 387.2 ppm September 2010 (preliminary): 389.2 ppm 39% above pre-industrial Annual Mea Growth Rate (ppm y-1) November 2010 2009 1.62 2008 1.80 2007 2.14 2006 1.84 2005 2.39 2004 1.60 2003 2.19 2002 2.40 2001 1.89 2000 1.22 Data Source: Pieter Tans and Thomas Conway, 2010, NOAA/ESRL
10 Total CO2 emissions 8 6 CO2 Partitioning (PgC y-1) 4 Atmosphere 2 1970 1980 2010 2000 1960 1990 Time (y) Key Diagnostic of the Carbon Cycle Evolution of the fraction of total emissions that remain in the atmosphere Updated from Le Quéré et al. 2009, Nature Geoscience; Data: NOAA 2010, CDIAC 2010
1.0 Trend: 0.31 % y-1 (p=~0.9) 0.8 45% 40% 0.6 Airborne Fraction 0.4 0.2 1970 1980 2010 2000 1960 1990 Time (y) Airborne Fraction Fraction of total CO2 emissions that remains in the atmosphere Updated from Le Quéré et al. 2009, Nature Geoscience; Raupach et al. 2008, Biogeosciences; Canadell et al. 2007, PNAS
2 0 Land sink (PgCy-1) 5 models -2 -4 -6 1970 2010 1980 2000 1960 1990 2 0 Ocean sink (PgCy-1) 5 models -2 -4 -6 1970 2010 1980 2000 1960 1990 Time (y) Modelled Natural CO2 Sinks Updated from Le Quéré et al. 2009, Nature Geoscience
2000-2009 (PgC) 10 5 Source deforestation CO2 flux(PgC y-1) 1.1±0.7 5 Sink 10 1950 2000 1900 1850 Time (y) Human Perturbation of the Global Carbon Budget Global Carbon Project 2010; Updated from Le Quéré et al. 2009, Nature Geoscience; Canadell et al. 2007, PNAS
2000-2009 (PgC) 10 fossil fuel emissions 7.7±0.5 5 Source deforestation CO2 flux(PgC y-1) 1.1±0.7 5 Sink 10 1950 2000 1900 1850 Time (y) Human Perturbation of the Global Carbon Budget Global Carbon Project 2010; Updated from Le Quéré et al. 2009, Nature Geoscience; Canadell et al. 2007, PNAS
2000-2009 (PgC) 10 fossil fuel emissions 7.7±0.5 5 Source deforestation CO2 flux(PgC y-1) 1.1±0.7 5 Sink 10 1950 2000 1900 1850 Human Perturbation of the Global Carbon Budget Time (y) Global Carbon Project 2010; Updated from Le Quéré et al. 2009, Nature Geoscience; Canadell et al. 2007, PNAS
2000-2009 (PgC) 10 fossil fuel emissions 7.7±0.5 5 Source deforestation CO2 flux(PgC y-1) 1.1±0.7 atmospheric CO2 4.1±0.1 5 Sink 10 1950 2000 1900 1850 Time (y) Human Perturbation of the Global Carbon Budget Global Carbon Project 2010; Updated from Le Quéré et al. 2009, Nature Geoscience; Canadell et al. 2007, PNAS
2000-2009 (PgC) 10 fossil fuel emissions 7.7±0.5 5 Source deforestation CO2 flux(PgC y-1) 1.1±0.7 atmospheric CO2 4.1±0.1 5 Sink ocean 2.3±0.4 ocean (5 models) 10 1950 2000 1900 1850 Time (y) Human Perturbation of the Global Carbon Budget Global Carbon Project 2010; Updated from Le Quéré et al. 2009, Nature Geoscience; Canadell et al. 2007, PNAS
2000-2009 (PgC) 10 fossil fuel emissions 7.7±0.5 5 Source deforestation CO2 flux(PgC y-1) 1.1±0.7 atmospheric CO2 4.1±0.1 land 5 2.4 (Residual) Sink ocean 2.3±0.4 (5 models) 10 1950 2000 1900 1850 Time (y) Human Perturbation of the Global Carbon Budget Global Carbon Project 2010; Updated from Le Quéré et al. 2009, Nature Geoscience; Canadell et al. 2007, PNAS
1.1±0.7 PgC y-1 4.1±0.1 PgC y-1 47% 2.4 PgC y-1 27% Calculated as the residual of all other flux components + 7.7±0.5 PgC y-1 26% 2.3±0.4 PgC y-1 Average of 5 models Fate of Anthropogenic CO2 Emissions (2000-2009) Global Carbon Project 2010; Updated from Le Quéré et al. 2009, Nature Geoscience; Canadell et al. 2007, PNAS
Anthropogenic Global Carbon Dioxide Budget Global Carbon Project 2010
Canadell JG et al. (2007) Contributions to accelerating atmospheric CO2 growth from economic activity, carbon intensity, and efficiency of natural sinks. PNAS 104: 18866–18870, http://www.pnas.org/content/104/47/18866.abstract Carbon Dioxide Information Analyses Center (CDIAC). http://cdiac.ornl.gov/trends/emis/meth_reg.html Davis S, Caldeira K (2010) Consumption-based accounting of CO2emissions. PNAS 107: 5687-5692. http://www.pnas.org/content/107/12/5687 International Monetary Fund (2010) World economic outlook. October 2010. http://www.imf.org/external/pubs/ft/weo/2010/02/ Global Forest Resources Assessment (2010) Food and Agriculture Organization of the United Nations; http://www.fao.org/forestry/fra/fra2010/en/ Friedlingstein P, Houghton RA, Marland G, Hackler J, Boden TA, Conway TJ, Canadell JG, Raupach MR, Ciais P, Le QuéréC.Update on CO2 emissions. Nature Geoscience, DOI 10.1038/ngeo_1022, Online 21 November 2010. http://www.nature.com/ngeo/journal/vaop/ncurrent/full/ngeo1022.html Global Carbon Project (2010) Carbon budget and trends 2009. http://www.globalcarbonproject.org/carbonbudget Le Quéré C, Raupach MR, Canadell JG, Marland G et al. (2009) Trends in the sources and sinks of carbon dioxide. Nature geosciences, doi: 10.1038/ngeo689. http://www.nature.com/ngeo/journal/v2/n12/full/ngeo689.html Peters GP, Hertwich E G (2008) CO2 embodied in international trade with implications for global climate policy. Environmental Science and Technology 42: 1401-1407. http://pubs.acs.org/doi/abs/10.1021/es072023k Raupach MR et al. (2007) Global and regional drivers of accelerating CO2 emissions. Proceedings of the National Academy of Sciences 14: 10288-10293.http://www.pnas.org/content/104/24/10288 Raupach MR, Canadell JG, Le Quéré C (2008) Drivers of interannual to interdecadal variability in atmospheric in atmospheric CO2 growth rate and airborne fraction. Biogeosciences 5: 1601–1613. http://www.biogeosciences.net/5/1601/2008/bg-5-1601-2008.html Tans P, Conway T (2010) Trends in atmospheric carbon dioxide. NOAA/ESRL www.esrl.noaa.gov/gmd/ccgg/trends van der Werf et al. (2010) Global fire emissions and the contribution of deforestation, savanna, forest, agricultural, and peat fires (1997–2009). Atmos. Chem. Phys. Discuss., 10, 16153-16230. http://www.atmos-chem-phys-discuss.net/10/16153/2010/acpd-10-16153-2010.html References cited in this ppt