Definitions
Ecosystem Analysis Using Probabilistic Relational Modeling Bruce D’Ambrosio, Eric Altendorf, Jane Jorgensen. Presented by Iulia Oroian and Leonard Rodrigo Tuesday Dec 2nd CSCE 582 Fall 2003 Instructor: Dr. Marco Valtorta. Definitions. Ecosystems

Definitions
E N D
Presentation Transcript
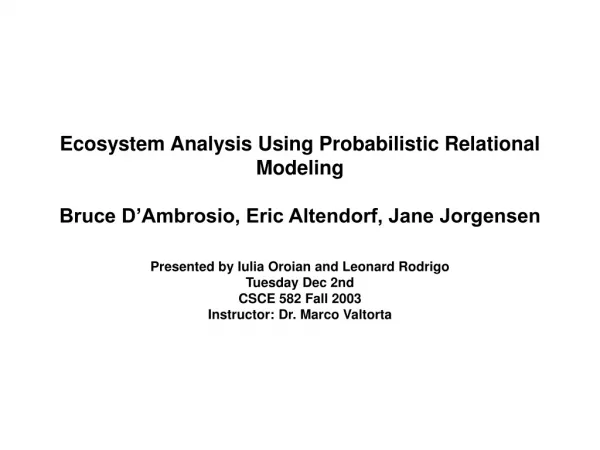
Ecosystem Analysis Using Probabilistic Relational ModelingBruce D’Ambrosio, Eric Altendorf, Jane Jorgensen Presented by Iulia Oroian and Leonard RodrigoTuesday Dec 2nd CSCE 582 Fall 2003Instructor: Dr. Marco Valtorta
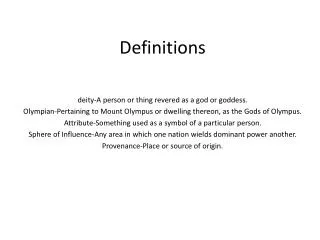
Definitions • Ecosystems • Systems composed of interacting populations of organisms and their environment • Community-level ecosystem model • An integrated model of the ecosystem as a whole • Synthetic variables • Variables derived from observational data • Aggregator • A “count” or value of a specific variable, included in the synthetic variable space
Goal • To aid domain scientists in gaining insight into data. • Controlled experimentation in an ecosystem is undesirable—therefore it is desirable to create comprehensive models from the vast amount of observational data available. • Generally, individual, domain-specific teams apply traditional statistical methods to investigate correlations among variables in their separate datasets. • Few methods exist for investigating the complex, noisy cross-disciplinary interactions that are crucial to understanding the ecosystem as a whole.
Abstract • Application of relational model discovery methods to building comprehensive ecosystem models from data. • In particular : two projects are considered - Crater Lake Ecosystem - West Nile Virus Disease Transmission • In both cases the relational probabilistic model discovery is applied for building “community level” models of the ecosystems.
Project 1: Crater Lake Problem • The NPS is concerned about long-term changes in the clarity of Crater Lake, a national park and the clearest deep-water lake in the world. • So far, linking various domain-specific surveys into one overall assessment of lake health has been lacking. • Using the relational model discovery methods the authors try to derive parameters that account for variations in explicit variables, like clarity of the lake water.
Project 1: Crater Lake Data • Data are obtained from long-term studies of the lake (some readings go back to 1880). • This data have been collected in tables using various time and spatial scales. • For example: surface weather condition information, phytoplankton densities, weather data at altitude. • Notice that the temporal and spatial granularity of the data varies: surface weather condition information, is available on a daily basis, weather phytoplankton densities are measured only once or twice a month, and weather data at altitude is rarely available.
Project 1: Crater Lake Method • A set of temporal units were chosen to frame the analysis. For this purpose expert knowledge was used. • These units were time periods corresponding to observed patterns of clarity of lake and for which data were available In the project: Jun-Jul, Aug, Sep-Oct
Project 1: Crater Lake Challenges • Problem: deal with the time, which wasn’t explicitly reified, therefore constructing paths like:“secchi.DesDepth.yrSegment.Phyto.density“ was a problem. Solution: manually add a “Season” table. • Problem: how to gain scientific insight into data Solution: learning models over not just variables in the provided tables, but over their parents as well.
Project 1: Crater Lake A complete schema for the data tables related to the temporal tables is shown in figure 1.
Project 1: Crater Lake • After performing the analysis ( meaning applying the relational model discovery method), the following essential elements showed in the discovered model.
Project 1: Crater LakeResults • One relationship that was discovered is that the dominant fish species in gill net catches was probabilistically dependent upon: - Secchi descending depth (water clarity) in the current year - mean fish weight in the current year - descending Secchi depth the previous year - dominant fish species two years previous
Project 1: Crater LakeResults Other findings: • the fact that schools of Kokanee smolts swimming at the edges of the lake were preyed upon by Rainbow trout and this phenomenon does not occur every year. A time lag of two years, discovered by the model, is consistent with experts’ observations. The relation between this interaction and water quality was previously unknown. • The centrality of water clarity (measured by the Secchi “DesDepth” parameter) • The lack of a direct relationship between Zooplankton count and water clarity. These findings suggest that fish attributes may serve as a predictor of water clarity.
Project 1: Crater LakeResults Another important result: learning models over not just the variables in the provide tables but over their parents as well provide additional insight. An example for the FishSpecimen table is shown in Fig3.
Project 2: West Nile Virus • Data available • Reports of dead birds testing positive • Reports of breeding populations of mosquitoes testing positive • Human case reports • Landscape type
Project 2: West Nile VirusDatabase Types • Static Type • Presence of permanent mosquito breeding sites (tire disposal facilities, etc) • Landscape type • Event Type • Located in place and time • Birds located testing positive for West Nile • Mosquitoes testing positive for West Nile
Project 2: West Nile VirusModeling Method • Attempt to create a model of the spread of the West Nile Virus in Maryland, 2001 • “Selectors” are used to relate the correct subset of values to other nodes.
Project 2: West Nile VirusRelating Different Databases • Location and Time are continuous variables • This is handled by creating a scale. The scale is determined by examining previous case studies such as the life-cycle of disease-carrying mosquitoes and flight distance of competent bird hosts. • In this particular study, the space / temporal scale consisted of 5 miles and 1 month. • Selectors • Implemented as boolean types—true for elements in the same range, and false for elements outside.
Project 2: West Nile ModelResults • The researchers found that there were insignificant cases to effectively use human and horses test cases to model the spread of the virus • The model was, however, reasonably accurate, thus possibly implying that it is not necessary to gather data on insignificant hosts such as horses.
Conclusions and Future Work • Relational probabilistic modeling provides a natural framework for investigating ecological data. • Based on the system’s relational database the methods of relational learning provide the opportunity to learn comprehensive models directly from the data sources. • There still are limitations in the current synthetic variable construction methods.