Download
1 / 13
130 likes | 139 Views
Characteristics of mesoscale eddies in the Southwest Pacific. Research by: Lydia Keppler (MSc student at PaCE-SD, USP-based in Germany) Supervisors: Dr. Awnesh Singh (USP, Fiji), Dr. Sophie Cravatte and Dr. Alexis Chaigneau (IRD, France). Outline. Introduction Data & methods

E N D
Characteristics of mesoscale eddies in the Southwest Pacific Research by: Lydia Keppler (MSc student at PaCE-SD, USP-based in Germany) Supervisors: Dr. Awnesh Singh (USP, Fiji), Dr. Sophie Cravatte and Dr. Alexis Chaigneau (IRD, France)
Outline • Introduction • Data & methods • Horizontal properties of eddies: • Where are the eddies • Characteristics • Summary
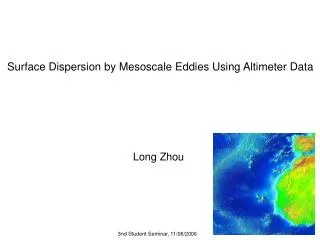
The study region Colour: bathymetry Vectors: absolute geostrophic velocity between 0 m and 1000 m from Kessler and Cravatte (2013)
What is a mesoscale eddy • Eddy: turbulent, spinning flow • Mesoscale (=not very small, not very big): between ~40 to ~200km in diameter • Cyclonic eddies (CE): lower sea level in the ocean • Anticyclonic eddies (AE): higher sea level in the ocean • The spinning of the earth creates a current around the low / high which is an eddy • They propagate westwards and can trap water and transport heat, salt & nutrients from their area of formation • They have an effect on ecosystems & the climate
Data • Satellite altimetry: Aviso Duacs2014 • (1993 to 2015) • Multi-satellite product: HY-2A, Saral/AltiKa, Cryosat-2, OSTM/Jason-2, Jason- 1, Topex/Poseidon, Envisat, GFO and ERS-1&2 • Measures sea surface height • Provides Sea Level Anomaly (SLA) in reference to a 20-year mean (1993 to 2012) • Daily, 1/4° x 1/4° global product Jason-2 spacecraft (image credit: CNES) Sea surface height on 28th August 1996 (Source: Chelton et al., 2011)
Methodology • Eddy detection algorithm by Pegliasco et al. 2015 • Finds local minimum and maximum (eddy centre) • Finds outermost closed contour line around the eddy centre (eddy edge) • Finds the same eddies on consecutive days and tracks them • Filters: • Min. amplitude: 2cm • Min. lifetime: 14 days • Min. radius: 40km • Sea level anomaly (in m) from Aviso on Jan 01 1993 in colour shading; • Detected eddies: • Contour lines show the detected eddy edge; • * mark AE centres (high) • o mark CE centres (low)
Eddy occurrence Number of days (between1993 to 2015) that have an eddy at a given location (AE & CE) (white regions are shallower than 200m) Number of eddies per latitude (AE: red, CE: blue) More eddies are counted in the South as they propagate slower there. They are also not interrupted by islands.
Eddy genesis Left: Location of Eddy genesis (AE and CE): West of islands Right: Number of eddies that form at each latitude: red: form East of the study region, green: form inside Why? Explained on next slide…
Eddy decay Top: Location of eddy decay (AE and CE): in the lee of islands Eddies often decay when encountering an island. This explains, why eddies are generated west of an island (previous slide): a pervious eddy decayed, a new one can form Bottom: Number of eddies that decay at each longitude: red: decay towards the South, blue: decay towards the North, green: decay inside the study region
Amplitude Left: Mean amplitude of AE and CE at a given location (absolute value) Right: Mean amplitude at each latitude: red: AE, blue: CE More eddies are higher in the South, because they live longer there (no interruption by islands). They are especially high in the EAC, as this Western Boundary currents creates strong and energetic eddies
Summary • Number of eddies • More eddies in the South • Genesis • In the lee (West) of islands or East of the study region • More in the North • Decay • East of the islands and plateaus or move North or South of the study region • More in the North • Amplitude • Mean: approx. 8 cm • Higher in the South, especially in the EAC
Thank you, • Vinaka vakalevu, • Dhanyavaad & • Dankeschön
Extra: Movie of the eddies in the study region • https://youtu.be/PYSA8QMG5Gg