Download
1 / 23
250 likes | 355 Views
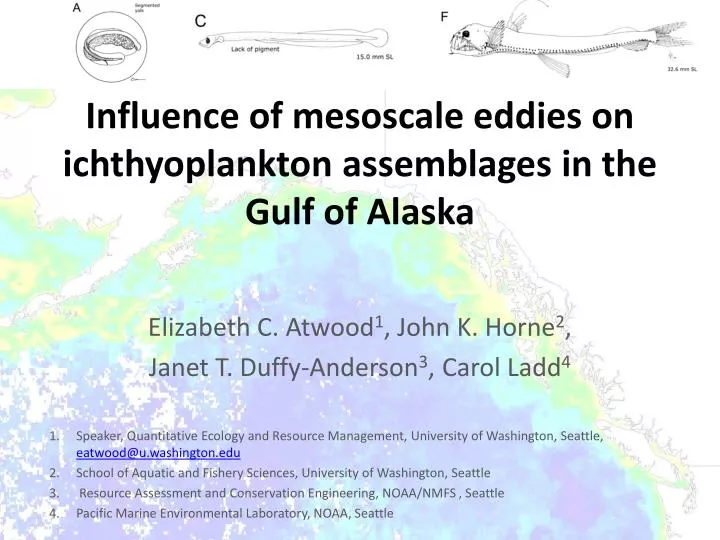
Influence of mesoscale eddies on ichthyoplankton assemblages in the Gulf of Alaska. Elizabeth C. Atwood 1 , John K. Horne 2 , Janet T. Duffy-Anderson 3 , Carol Ladd 4 Speaker, Quantitative Ecology and Resource Management, University of Washington, Seattle, eatwood@u.washington.edu

E N D
Influence of mesoscale eddies on ichthyoplankton assemblages in the Gulf of Alaska Elizabeth C. Atwood1, John K. Horne2, Janet T. Duffy-Anderson3, Carol Ladd4 Speaker, Quantitative Ecology and Resource Management, University of Washington, Seattle, eatwood@u.washington.edu School of Aquatic and Fishery Sciences, University of Washington, Seattle Resource Assessment and Conservation Engineering, NOAA/NMFS , Seattle Pacific Marine Environmental Laboratory, NOAA, Seattle
Larval dispersal • Ichthyoplankton dispersal • Influences species growth, survival and recruitment success • Oceanographic conditions • Impact larval dispersal trajectories Beneficial Detrimental Inappropriate slope habitat Nursery shelf habitat
Mesoscale eddies in the GOA • Coastal origin, shelf-break eddies (cir. 100 km diameter) • High cross-shelf water exchange • Influence nutrient, chlorophyll, and zooplankton • Eddies: Haida, Sitka, and Yakutat Log(Chl) 4.0 3.2 2.4 1.6 0.8 Chlorophyll data from Giovanni, http://disc.sci.gsfc.nasa.gov/giovanni/
Mesoscale eddies in the GOA • Coastal origin, shelf-break eddies (cir. 100 km diameter) • High cross-shelf water exchange • Influence nutrient, chlorophyll, and zooplankton • Eddies: Haida, Sitka, and Yakutat Log(Chl) 4.0 3.2 2.4 1.6 Yakutat 0.8 Sitka Haida Chlorophyll data from Giovanni, http://disc.sci.gsfc.nasa.gov/giovanni/
Study objectives • Identify assemblage patterns within and between eddies • Evidence for eddy entrainment of semi-passive ichthyoplankton
GOA eddy data collection Yakutat • 2005 data collection • Cruise in April/ May • Ladd et al., 2009 • Biological & physical data • Bongo: eggs, larvae, and juvenile density • CTD and bottle: Sitka Haida • a suite of oceanographic variables • Mixed Layer Depth (MLD) • Satellite sea surface height (SLA), measure of eddy location 333 μm mesh 60 cm diameter
assemblage patterns Hierarchical clustering ofspecies matrix Yakutat Sitka Haida Group: 1 45 2 3
assemblage patterns Hierarchical clustering ofspecies matrix • Haida eddy group (2) • Coastal group (3) • Mixed Sitka and Yakutat groups (4 and 5) Yakutat Sitka Haida Group: 1 45 23
assemblage patterns Comparing clustersspecies matrix Low Low/ Medium Medium Heatmap analysis High/ Medium High Species Stations
assemblage patterns Comparing clustersspecies matrix Low Low/ Medium Medium Heatmap analysis High/ Medium High Species Group: Edge S/ Y int.S/ Y int. Haida Coastal Stations
assemblage patterns Comparing clustersspecies matrix Low Low/ Medium Medium Heatmap analysis • Southern species group High/ Medium High Species Blue lanternfish California flashlightfish Ragfish Myctophidae Group: Edge S/ Y int.S/ Y int. Haida Coastal Stations
assemblage patterns Comparing clustersspecies matrix Low Low/ Medium Medium Heatmap analysis • Southern species group • Abundant species group >75% overall catch High/ Medium High Northern lampfish Rockfish Pacific blacksmelt Northern flashlightfish Arrowtooth flounder Sablefish Species Group: Edge S/ Y int.S/ Y int. Haida Coastal Stations
assemblage patterns Hierarchical clusteringoceanographic matrix • Variables • (above MLD): • bottom depth, temp, salinity, density (σT) , chlorophyll, oxygen, PO4, SiO4, NO3, • SLA Group: 5 4 2 1 6 3
assemblage patterns Comparing clusters species to oceanographic Low Low/ Medium Heatmap analysis Medium High/ Medium High Species Group: S int. S int.EdgeOutside Y cen. H/ S cen. Stations
assemblage patterns Comparing clusters species to oceanographic Low Low/ Medium Heatmap analysis • Abundant species group concentrated in center stations Medium High/ Medium High Northern lampfish Rockfish Pacific blacksmelt Northern flashlightfish Arrowtooth flounder Sablefish Species Group: S int. S int.EdgeOutside Y cen. H/ S cen. Stations
assemblage patterns Observed patterns • Species matrix clustering • Latitudinal gradient suggested by presence of southern species group • Presence of an abundant species group • Oceanographic matrix clustering • Clean clustering into center, edge, and outside eddy groups • Connections between species and ocean matrices • Concentration of abundant species group in the center eddy stations
eddy entrainment Ichthyoplankton entrainment • Diversity measures Species richness Species turnover for each haul between consecutive hauls • Regression analysis • Larval response to eddy position Species richness βW βI βR
eddy entrainment Ichthyoplankton entrainment • Diversity measures Species richness Species turnover for each haul between consecutive hauls • Regression analysis • Larval response to eddy position Species richness βW βI βR Peaks within an eddy Peaks along eddy edge
eddy entrainment Regression analyses Transformed density by log(distance) • (density)1/4 = 4.90 - 0.23*log(dist) + ε • r2 = 0.118 • p = 0.1176 • Density • Abundant species group • Simple linear regression • Negative correlation, but not significant • Diversity • Species richness • General Linear Model (gamma family) • Negative correlation and significant (density)1/4 Log(distance) Diversity by log(distance) • (diversity)1/4 = • 1 • (0.07 - 0.02*log(dist) + ε) • AIC = 74.801 • p = 0.00025 Species richness Log(distance)
eddy entrainment Regression analyses Transformed density by log(distance) • (density)1/4 = 4.90 - 0.23*log(dist) + ε • r2 = 0.118 • p = 0.1176 • Density • Abundant species group • Simple linear regression • Negative correlation, but not significant • Diversity • Species richness • General Linear Model (gamma family) • Negative correlation and significant (density)1/4 Log(distance) Diversity by log(distance) • (diversity)1/4 = • 1 • (0.07 - 0.02*log(dist) + ε) • AIC = 74.801 • p = 0.00025 Species richness Log(distance)
eddy entrainment Regression analyses Transformed density by log(distance) • (density)1/4 = 4.90 - 0.23*log(dist) + ε • r2 = 0.118 • p = 0.1176 • Density • Abundant species group • Simple linear regression • Negative correlation, but not significant • Diversity • Species richness • General Linear Model (gamma family) • Negative correlation and significant (density)1/4 Log(distance) Diversity by log(distance) • (diversity)1/4 = • 1 • (0.07 - 0.02*log(dist) + ε) • AIC = 74.801 • p = 0.00025 Species richness Log(distance)
Evidence for entrainment • Assemblage patterns: clustering • Latitudinal species gradient • Eddy center concentration of abundant species group • Eddy entrainment: Regression (density, diversity) • Negative correlation to distance from eddy center • Potential vector for larval dispersal • Beneficial or detrimental
Thank you to my co-authors: John K. Horne, Janet T. Duffy-Anderson, and Carol Ladd Work kindly funded by NPRB and AFSC Thanks to the crew of the R/V Thompson G. Thompson Questions?


![Freshwater Variability on the Gulf of Alaska Shelf [ OS42A-01 ]](https://cdn2.slideserve.com/3972677/slide1-dt.jpg)