Download

1 / 32
320 likes | 397 Views
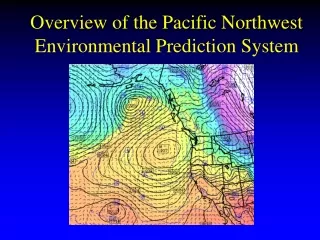
The University of Washington Pacific Northwest Mesoscale Analysis System. Brian Ancell, Cliff Mass, Gregory J. Hakim University of Washington. Motivation. High-resolution analyses are important for: Operational forecasting (fire weather, air quality..). Motivation.

E N D
The University of Washington Pacific Northwest Mesoscale Analysis System Brian Ancell, Cliff Mass, Gregory J. Hakim University of Washington
Motivation • High-resolution analyses are important for: • Operational forecasting (fire weather, air quality..)
Motivation • High-resolution analyses are important for: • Operational forecasting (fire weather, air quality..) • Studying the mesoscale effects of climate change
Motivation • High-resolution analyses are important for: • Operational forecasting (fire weather, air quality..) • Studying the mesoscale effects of climate change • Alternative energy development
Motivation • High-resolution analyses are important for: • Operational forecasting (fire weather, air quality..) • Studying the mesoscale effects of climate change • Alternative energy development • Pacific Northwest complex terrain presents a challenge to creating good analyses • Flow-dependence during data assimilation may be vital
An Attractive Option: EnKF • An ensemble Kalman filter (EnKF) has strong potential for mesoscale analysis: • Observational information is spread spatially using flow-dependent statistics
An Attractive Option: EnKF Temperature observation 3DVAR EnKF
An Attractive Option: EnKF • An ensemble Kalman filter (EnKF) has strong potential for mesoscale analysis: • Observational information is spread spatially using flow-dependent statistics • Analysis and forecast uncertainty is easily calculated and is also flow-dependent
An Attractive Option: EnKF • An ensemble Kalman filter (EnKF) has strong potential for mesoscale analysis: • Observational information is spread spatially using flow-dependent statistics • Analysis and forecast uncertainty is easily calculated and is also flow-dependent • Computational resources can handle EnKF demand
How the EnKF Works • An analysis is created from: 1) An ensemble of short-term forecasts (Background) 2) Observations For a single observation: Observation (T1) Mean Forecast (T2) Observation Variance (V1) Forecast Variance (V2) Analysis (T3,V3)
How the EnKF Works • An analysis is created from: 1) An ensemble of short-term forecasts (Background) 2) Observations For a single observation: Observation (T1) Mean Forecast (T2) Observation Variance (V1) Forecast Variance (V2) Analysis (T3,V3) Analysis increment then spread spatially using covariance statistics of ensemble
EnKF Configuration • Large, coarse domain EnKF already tested (Torn and Hakim 2008) - EnKF competitive with global models
EnKF Configuration D3 (4km) D2 (12km) D1 (36km)
EnKF Configuration • WRF model V2.1.2 • 38 vertical levels • 80 ensemble members • 6-hour update cycle • Observations: • Surface temperature, wind, altimeter • ACARS aircraft winds, temperature • Cloud-track winds • Radiosonde wind, temperature, relative humidity Half of surface obs used for assimilation, other half for verification
36-km vs. 12-km EnKF 36-km 12-km SLP, 925-mb temperature, surface winds
36-km vs. 12-km EnKF 36-km 12-km SLP, 925-mb temperature, surface winds
36-km vs. 12-km EnKF 36-km 12-km SLP, 925-mb temperature, surface winds
EnKF 36-km vs. 12-km Wind Temperature Improvement of 12-km EnKF Analysis 10% 13% Forecast 10% 10%
Issue #1 – Representative Error • Model terrain = Actual terrain at and near observation sites Model terrain Actual terrain
Surface Observations Model grid points (12-km resolution) Model grid points (12-km resolution)
Surface Observations Model grid points (12-km resolution) Observation location Model grid points (12-km resolution)
Surface Observations Model grid points (12-km resolution) High-resolution terrain data (1.33 km resolution) Observation location Model grid points (12-km resolution)
Issue #1 – Representative Error • Using representative observations only, we can reduce observation uncertainty: Observation Standard Deviations Temp: 1.8 K (36-km) 1.0 K (12-km) Wind: 2.5 m/s (36-km) 1.5 m/s (12-km)
Issue #1 – Representative Error • Using representative observations only, we can reduce observation uncertainty: Observation Standard Deviations Temp: 1.8 K (36-km) 1.0 K (12-km) Wind: 2.5 m/s (36-km) 1.5 m/s (12-km) Drawback: Lose ~75% of available surface obs
Issue #1 – Representative Error Wind Temperature Improvement using reduced observation uncertainty Analysis 5% 10%
Issue #2 – Lack of Background Surface Variance • Too little background variance exists in model surface fields
Issue #2 – Lack of Background Surface Variance • Too little background variance exists in model surface fields Solution: Inflate surface variance with variance aloft
Issue #3 – Model Surface Bias • Significant biases exist in the model surface wind and temperature fields Temperature Bias Light Wind Speed (<3 knots) Bias
Further Improvement After Variance Inflation, Bias Removal Wind Temperature Improvement using inflation and bias removal Analysis 9% 3%
EnKF 12-km vs. GFS, NAM, RUC Wind Temperature RMS analysis errors GFS 2.38 m/s 2.28 K NAM 2.30 m/s 2.54 K RUC 2.13 m/s 2.35 K EnKF 12-km 1.85 m/s 1.67 K
12-km vs 4-km EnKF 12-km 4-km SLP, 925-mb temperature, surface winds
Summary • A multi-scale, nested WRF EnKF (36km, 12km, 4km) is being tested over the Pacific Northwest to produce quality analyses and short-term forecasts • Three obstacles to accurate surface analyses were discovered and dealt with using the 12-km EnKF: • Poor model terrain height profile (representative check) • Lack of model surface forecast variance (variance inflation from aloft) • Model surface wind and temperature bias (pre-assimilation bias removal) • Resulting WRF 12-km EnKF surface analyses were better than the WRF 36-km EnKF, GFS, NAM, and RUC • Future direction: • Better bias removal techniques • Tuning of data assimilation parameters • Testing of 4-km nested domain • Evaluation of analysis fields aloft • Short-range forecast verification • Comparison with current NWS mesoscale analysis techniques (RTMA, MOA)