Download
1 / 16
160 likes | 286 Views
Surface Dispersion by Mesoscale Eddies Using Altimeter Data. Long Zhou. 3nd Student Seminar, 11/06/2006. Outline Objectives and Applications Dataset Method One example of model output Results Summary and future work. Objectives Examine absolute dispersion at ocean surface

E N D
Surface Dispersion by Mesoscale Eddies Using Altimeter Data Long Zhou 3nd Student Seminar, 11/06/2006
Outline • Objectives and Applications • Dataset • Method • One example of model output • Results • Summary and future work
Objectives • Examine absolute dispersion at ocean • surface • Find out the relative diffusivities • at different separation distances • Applications • Improve parameterization of eddy diffusivity in climate numerical modeling • Pollutant fate (e.g. oil spills) • Larval transport
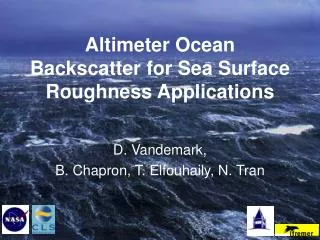
Dataset: Satellite altimetry • JETEG along-track sea level anomalies (SLA) for three years • 02/25/2003 to 02/25/2006 Note: GFO=Geosat Follow-on
Method • Objective mapping of JETEG with a space-time correlation model => daily SLA maps (02/25/2003 to 02/25/2006). • Derive stirring velocities Vs from SLA assuming geostrophic balance holds. • Random walk numerical model with a daily time step and 1/6 degree of spatial resolution. • , where
One example of model output: where to deploy KE: kinetic energy
One example of model output • 03/02/2003-07/30/2003
3 3 0.5-0.9 0.5-0.9 0.1 0.1 • Results • Find RDV to be 0.75 to reasonably represent submesoscale process.
At scale of less than 200 km, relative diffusivity grow quadratically. • Later can be scaled as distance to the 2/3 power.
Summary • RDV=0.75 to reasonably represent submesoscale process. • Absolute dispersion: zonal > meridional. • Relative diffusivities can be scaled with separation distance. • Future Work • Statistical analysis of ensembles • Add larva growth rate
Acknowledgement • GSO: • Dave Hebert • Tom Rossby • WHOI: • Valery Kosnyrev • Dennis McGillicuddy • Real-time Altimeter Data Research Group at Colorado Center for Astrodynamics • CLS Space Oceanography Division