Download
1 / 27
270 likes | 482 Views
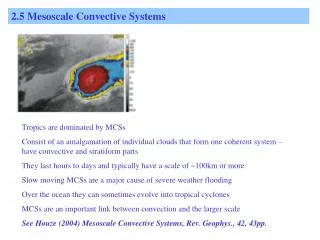
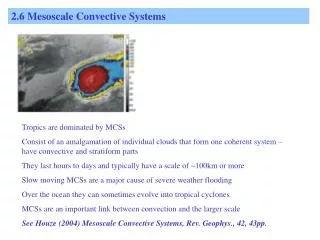
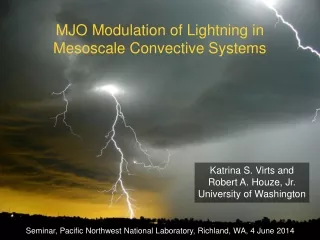
Total Lightning Characteristics in Mesoscale Convective Systems. Don MacGorman NOAA/NSSL & Jeff Makowski OU School of Meteorology. Data Sources. Lightning Oklahoma Lightning Mapping Array (OK-LMA) National Lightning Detection Network (NLDN)

E N D
Total Lightning Characteristics in Mesoscale Convective Systems Don MacGorman NOAA/NSSL & Jeff Makowski OU School of Meteorology
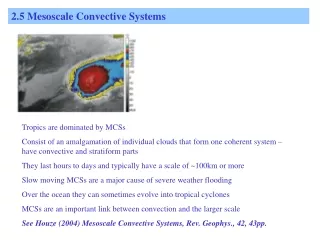
Data Sources • Lightning • Oklahoma Lightning Mapping Array (OK-LMA) • National Lightning Detection Network (NLDN) • National composite base-scan radar reflectivity • Level II base-scan radar reflectivity • GOES infrared satellite From MacGorman et al. (2008)
Methodology • Studied 30 MCSs which were within the OK-LMA domain for >3 hours and isolated from neighboring convection between 2003 and 2009 • Classified each MCS according to mode of organization • Analyzed OK-LMA flash initiations and NLDN CG strikes relative to radar reflectivity and IR cloud shield • Computed cloud shield area < -52, -54, -60, -66, and -72 ˚C and minimum brightness temperature for each infrared satellite scan
Lightning Summary • 21% of all flashes were cloud-to-ground (CG) strikes • 13% of all CGs lowered positive charge to ground • Maximum total flash rate (average over 30 min period) across all cases was 700 flashes per minute (fpm) with average maximum flash rate of 179 fpm • Maximum CG flash rate (average over 30 min period) across all cases was 180 fpm with average maximum flash rate of 37 fpm
OK -LMA Initiation Points and Radar Reflectivity for a Symmetric MCS LMA initiation points for 10-min period centered on 0435 UTC, 12 June 2003
CG Flashes and Radar Reflectivity for 12 June 2003 MCS ‘+’ indicates positive ground strike
CG Flashes and Radar Reflectivity for 14 May 2003 MCS ‘+’ indicates positive ground strike
OK-LMA Initiation Points, NLDN Ground Strikes and Radar Reflectivity for an Asymmetric MCS LMA initiation points (white) and NLDN ground strikes (black) for 10-min period centered on 1135 UTC, 6 July 2004
OK-LMA Initiation Points and Radar Reflectivity for an Unclassifiable MCS LMA initiation points for 10-min period centered on 0805 UTC, 22 August 2005
OK-LMA Initiation Points and Radar Reflectivity for 1 July 2004 MCS 0405 UTC 0605 UTC 0805 UTC
Composite Mean of Total and CG Flash Rates CG Lightning Total Lightning
Total and CG Lightning Histograms for 19 August 2007 MCS Total activity denoted by bars CG activity denoted by solid line
Total CG and +CG Flash Histograms for 19 August 2007 MCS +CG activity denoted by bars Total CG activity denoted by bars
Infrared Satellite and Radar Reflectivity Overlaid with OK-LMA Initiation Points for 30 May 2007 MCS 1105 UTC
Infrared Satellite and Radar Reflectivity Overlaid with OK-LMA Initiation Points for 21 June 2004 MCS 1105 UTC
Maximum Total and CG Flash Rates vs. Maximum -52 ˚C Cloud Shield Area CG Lightning Total Lightning
Maximum Total and CG Flash Rates vs. Minimum Cloud Shield Temperature CG Lightning Total Lightning
Total and CG Flash Rates vs. Maximum -52 ˚C Cloud Shield Growth Rate Total Lightning CG Lightning
Total Lightning Evolution Relative to Cloud Shield Area for 27 May 2008 MCS -60 ˚C -52 ˚C Time series of total lightning shown in red, with cloud shield area shown in black -72 ˚C
Total Lightning Evolution Relative to Cloud Shield Area and Minimum Cloud Top Temperature for 1 July 2004 MCS -60 ˚C -52 ˚C Minimum Brightness Temperature Time Series of total lightning shown in red, with time series of cloud shield area shown in black and minimum brightness temperature shown in gray -60 ˚C
Composite Time Series of Total Lightning Relative to -52 and -66 ˚C Cloud Shield Area -52 ˚C Cloud Shield -66 ˚C Cloud Shield Total lightning evolution shown in red, with black line indicating cloud shield evolution
Summary • CG and total lightning flash rates usually evolve similarly, but ground flash fraction tends to increase as deep convection weakens • Most lightning initiated within deep convection; fewer flashes initiated within stratiform precipitation • Timing of evolution of flash rates is most similar to timing of evolution of coldest cloud shield • Flash initiations depict configuration of deep convection better than IR cloud shield -- comparable to depiction by radar reflectivity
Total and CG Lightning Histograms for 30 April 2004 MCS Total activity denoted by bars CG activity denoted by solid line