Download
1 / 15
150 likes | 1.15k Views
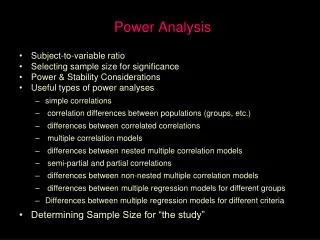
Power Analysis for Correlational Studies. Remember that both “power” and “stability” are important! Useful types of power analyses simple correlations correlation differences between populations (groups, etc.) differences between correlated correlations multiple correlation models

E N D
Power Analysis for Correlational Studies • Remember that both “power” and “stability” are important! • Useful types of power analyses • simple correlations • correlation differences between populations (groups, etc.) • differences between correlated correlations • multiple correlation models • differences between nested multiple correlation models • semi-partial and partial correlations • differences between non-nested multiple correlation models • differences between multiple regression models for different groups • Differences between multiple regression models for different criteria
We know from even rudimentary treatments of statistical power analysis that there are four attributes of a statistical test that drive the issue of selecting the sample size needed a particular analysis… • acceptable Type I error rate (chance of a “false alarm”) • acceptable Type II error rate (chance of a “miss”) • size of the effect being tested for (.1=small, .3=med, .5=large) • sample size for that analysis We also know that power is not the only basis for determining “N” The stability/variability of each r in thecorrelation matrix is related to N Std of r = 1 / (N-3), so … N=50 r +/- .146 N=100 r +/- .101 N=200 r +/- .07 N=300 r +/- .058 N=500 r +/- .045 N=1000 r +/- .031
Power Analysis for Simple Correlation On the following page is a copy of the power analysis table from the first portion of the course. Some practice... Post hoc I found r (22) = .30, p < .05, what’s the chance I made a Type II error ?? N = Power = Chance Type II error A priori #1 I expect my correlation will be about .25, & want power = .90 sample size should be = #2 Expect correlations of .30, .45, and .20 from my three predictors & want power = .80 sample size should be = 24 .30 .70 160 191, based on lowest r = .20
Power analysis for correlation differences between populations • the Bad News • this is a very weak test -- requires roughly 2x the N to test for a particular r-r value than to test for a comparable r-value • the Good News • the test is commonly used, well-understood and tables have been constructed for our enjoyment (from Cohen, 1988) • Important! Decide if you are comparing r or |r| values • r1 - r2 .10 .20 .30 .40 .50 .60 .70 .80 • Power • .25 333 86 40 24 16 12 10 8 • .50 771 195 88 51 34 24 19 15 • .70 1237 333 140 89 52 37 28 22 • .80 1573 395 177 101 66 47 35 28 • .90 2602 653 292 165 107 75 56 44 • all values for = .05 Values are “S” which is total sample size
Power Analysis for Comparing “Correlated Correlations” • It takes much more power to test the H0: about correlations differences than to test the H0: about each r = .00 • Most discussions of power analysis don’t include this model • Some sources suggest using the tables designed for comparing correlations across populations (Fisher’s Z-test) • Other sources suggest using twice the sample size one would use if looking for r = the expected r-difference (works out to about the same thing as above suggestion) • Each of these depends upon having a good estimate of both correlations, so that the estimate of the correlation difference is reasonably accurate • It can be informative to consider the necessary sample sizes for differences in the estimates of each correlation
Here’s an example … • Suppose you want to compare the correlations of GREQ and GREA with graduate school performance. • Based on a review of the literature, you expect that… • GREQ and grad performance will correlate about .4 • GREA and grad performance will correlate about .6 • so you would use the value of r-r = .20 … • and get the estimated necessary sample size of N = 395 • To consider how important are the estimates of r… • if the correlations were .35 and .65, then with r-r = .30, N= 177 • if the correlations were .45 and .55, the with r-r=.10, N= 1573
Power Analysis for comparing nested multiple regression models (R²)… The good news is that this process is almost the same as was the power analysis for R². Now we need the power of … R²L - R²S / kL - ks R²L - R²S N - kl - 1 F = -------------------------- = --------------- * ------------ 1 - R²L / N - kl - 1 1 - R²L kL - ks Which, once again, corresponds to: significance test = effect size * sample size the notation we’ll use is … R2Y-A,B - R2Y-A -- testing the contribution of the “B” set of variables
Using the power tables (post hoc) for R² (comparing nested models) requires that we have four values: a = the p-value we want to use (usually .05) w = # predictors different between the two models) u= # predictors associated with the smaller model v = df associated with F-test error term (N - u - w - 1) f² = (effect size estimate) = (R²L - R²S) / (1 - R²L) = f² * ( u + v + 1) , where Post Hoc E.g.,N = 65, R²L (k=5) = .35, R²S (k=3) = .15 a = .05 w = 2 u = 3 v = 65 - 2 - 3 - 1 = 59 f² = .35 - .15 / 1 - .35 = .3077 = .3077 * (3 + 59 + 1) = 19.4 Go to table -- a = .05 & u = 3 = 20 power about .97 v = 60.97
a priori power analyses for nested model comparisons are probably most easily done using the “what if “ approach I expect that my 4-predictor model will account for about 12% of the variance in the criterion and that including an additional 3 variables will increase the R² to about .18 -- what sample size should I use ??? a = .05 w = 3 u= 4 f² = (RL² - RS²) / (1 - R²) =(.18 - .12) / (1 - .18) = .073 “what if..” N = 28 N = 68 N = 128N = 208 () v= (N - u - w - 1) = 20 60 120 200 () = f² * ( u + v + 1) = 1.83 4.75 9.13 15.0 Using the table… power = < .15 about .37 about .64 about .89 If we were looking for power of .80, we might then try N = 158 so v = 150, = 11.3 power = about .77(I’d go with N = 180 or so)
Power Analysis for Semi-partial Correlations A semi-partial correlation can be obtained from the difference between two multiple regression models… rY(,A.B) = √ R²Y.AB - R²Y.B or … … the correlation between Y & A, controlling A for B, is the square root of the unique contribution of A to the A-B model So,we could perform power analyses for semi-partial correlations using the same process we use for a nested model comparison. Now we need the power of … R²Y.AB - R²Y.B F = ------------------------------ 1 - R²Y.AB / N - kL – 1 note: kL – kS = 1 While simple to calculate, the difficulty with this approach is that we need to know not only the expected value of the semi-partial, but also of the related multiple R2 – something that we rarely have! For this reason, the common (and workable) way to estimate sample size for a semi-partial correlation is to use the power table for a simple correlation
Power Analysis for Multiple Semi-partial Correlations Any semi-partial or multiple semi-partial uses the same idea … rY(,A.B,C,D) = √ R²Y.ABCD - R²Y.BCD or … … the correlation between Y & A, controlling A for B, C & D, is the square root of the unique contribution of A to the ABCD model So,we perform power analyses for semi-partial correlations using the same process we use for a nested model comparison. Now we need the power of … R²Y.ABCD - R²Y.BCD F = -------------------------------------- 1 - R²Y.ABCD / N - kL – 1 This has the same problem as a estimating power for a semi-partial, with the same solution – use correlation power table as an estimate of a proper sample size.
Power Analysis for Partial Correlations A partial correlation can be obtained from the difference between two multiple regression models (re-scaled a bit) … √ R²Y.AB - R²Y.B r Y(,A.B) = ------------------------ 1 - R²Y.B So, we perform power analyses for partial correlations using the same process we use for a nested model comparison. Now we need the power of … R²Y.AB - R²Y.B F = ------------------------------ 1 - R²Y.AB / N - kL – 1 note: kL – kS = 1 This has the same problem as a estimating power for a semi-partial, with the same solution – use correlation power table as an estimate of the proper sample size
Testing non-nested multiple regression models… • It is essentially the same process as you used earlier for comparing “correlated correlations”… • What we will do is… • estimate each of the correlation values • R for the one model • R for the other model • find R-R and apply the Fisher’s Z-test power table
Comparing multiple regression models across groups Remember, there are two portions of this comparison – we need to do the power for each 1. Comparing how well the predictors “work” for the two groups -- estimate Rg1-Rg2 and apply the Fisher’s Z-test power table 2. Comparing the “structure” of the model from the 2 groups -- estimate Rdirect – Rcross and apply the Fisher’s power table (this is an approximation, as was using this table for correlated correlations earlier)
Comparing multiple regression models across criteria Comparing the “structure” of the model from the 2 criteria -- estimate Rdirect – Rcross and apply the Fisher’s power table (this is an approximation, as was using this table for correlated correlations earlier) Notice how blythly we say we will estimate all of these R-values in these last two types of power analyses. Often we can’t estimate them well, and should play the “what-if” game to consider what power we will have for different possibilities!!!