Download
1 / 23
230 likes | 377 Views
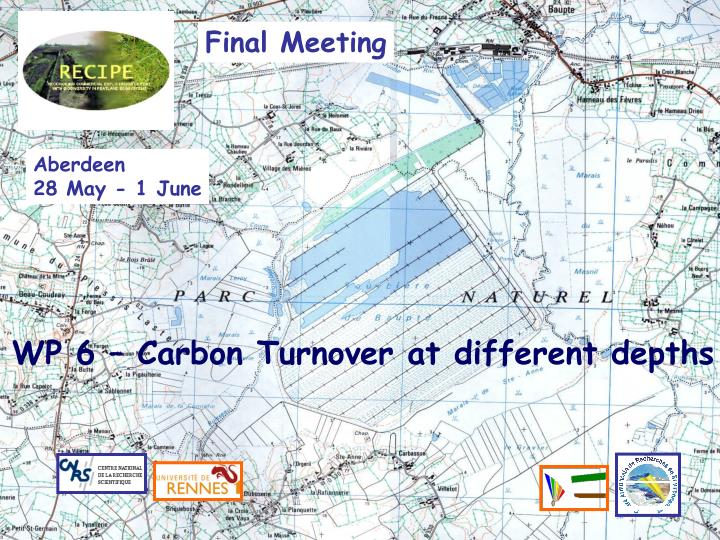
Final Meeting. Aberdeen 28 May - 1 June. WP 6 – Carbon Turnover at different depths. Plan. Introduction Objectives and deliverables Presentation of last main results (WPI to WPIII) : Keeling plots Microbial biomass and activity Coupling microbiological and organic chemistry variables

E N D
Final Meeting Aberdeen 28 May - 1 June WP 6 – Carbon Turnover at different depths
Plan • Introduction • Objectives and deliverables • Presentation of last main results (WPI to WPIII) : • Keeling plots • Microbial biomass and activity • Coupling microbiological and organic chemistry variables • Peat basal respiration (CO2-CH4 profiles) • Microbiological indexing systems • Considering the microbioligical variables as indicators • Disturbance, resilience, regeneration … • Microbial community functioning vs secondary succession • Concluding remarks
Objectives • To determine the impact of recolonizing vegetation (Sphagnacae, vascular plants) on soluble organic forms of C and N and emissions of CO2 and CH4 from restored cut-over sites • To correlate rates of C turnover with structure of microbial communities (WP03) and the peat organic matter components at different depths (WP05) • To relate C turnover to management practices and procedures at different time scales
Deliverables • D 19 – Production of isotopically labelled 13C/15N • WP III : lab and field experiment • D20 - Establishment of regeneration thresholds in terms of « link-source » and assessment of the origin of C in gaseous efflux • WP I : field experiment • Connexion with D6, D7 (WP02), D23 (WP 07) • Keeling plots (Daniel E. presented by AJ + ) • D21 - Modelling CO2-CH4-Microbial biomass C potential ratios in different cases of peatland restoration including the influence of N-litter • WP I + WP II + WP III • Connexion with D16 (see Fatima report on WP5) • Effect of plant species on microbial biomass (AJ) • Modelling microbiological indicators (AJ) • CO2/CH4 peat profiles (Andy)
Results WP I & II …. 1 - Keeking plots 2 - Microbial biomass 3 - Coupling microbiological and organic chemistry variables 4 - Peat basal respiration (CO2-CH4 profiles)
13C of bulk organic matter (‰) Mosses -28.16 0.05 Vascular plants -26.50 0.44 Peat cores : advanced regeneration -27.31 0.19 recent regeneration -26.21 0.12 bare peat -25.98 0.12 13C of respired CO2 -28 Advanced Recent Bare peat -26 -24 -22 -20 -18 -16 May 05 July 05 Aug 05 D20 - Establishment of regeneration thresholdsOld peat vs new peat: measurements of 13C (Keeling Plots method) • Objective : determination of the contribution of new peat and old peat to CO2 emission • The isotopic signature of respired CO2 ranged between -19.5 and -26.5 ‰ and it varied among plots and seasons • Bare peat respired more 13C enriched CO2 than revegetated plots • This is consistent with the isotopic signatures of bulk organic matter of peat and vegetation • Respired CO2 is enriched in 13C when compared with bulk organic matter, suggesting negative fractionation during respiration
FI SC FB FR D21 - Modelling CO2-CH4-Microbial biomass C potential ratios Effect of Living plants and Water level on microbial pools • No significant effect of plant and water level on soluble C-N-C/N • Only a significant effect of plant on C and N microbial biomasss • Kruskal-Wallis test
D21 - Modelling CO2-CH4-Microbial biomass C potential ratios Effect of Litter plants and Water level on microbial pools • No effect on C microbial biomass • Increasing N microbial biomass under Eriophorum litter (EA : 85 1 ppm ; EV : 6310) and no difference between bare peat and Sphagnum (BP : 46 9 ppm and S : 42 9) • Microbial C/N lower with Eriophorum litter (EA : 4.51.0 and EV : 7.11.1) vs higher values in bare peat and Sphagnum treatment (BP : 8.6 0.9 and S : 9.4 0.9) Kruskal-Wallis test
Coupling microbial variables –organic chemistrymultivariate analyses using constrained ordination methods (Co-inertia) Biological Variables in the Co-inertia plan 1 (All sites) The main contributions in the co-inertia analysis were : biological variables (to be explained) Axis 1 C and N microbial biomasses and Anaerobic Activity Axis 2 Aerobic activity and C microbial turnover Chemical Variables in the Co-inertia Plan 2 (All sites) organic chemical variables (explicative) Axis 1 Total Organic C, Preserved Tissues, Hemicellulose and Galactose Axis 2 Total Organic N, Amorphous Organic matter and Decayed Tissues
Results WP I & II …. 4 - Peat basal respiration (CO2-CH4 profiles) Andy
Microbiological indexing systems for assessing regeneration of peat accumulation process 1 - Considering the microbioligical variables as indicators 2 - Disturbance, resilience, regeneration … 3 - Microbial community functioning vs secondary succession
Microbiological indexing systemsto assess peatland regeneration trends
Disturbance Function (ex : C sink) Regeneration process Steady state New steady state A B C Loss of C Gain of C Time D20-21 - Modelling CO2-CH4-MB potential ratios : Towards other Deliverables in the research of ecological indicators of peat regeneration …. Disturbance, resilience, regeneration …. Relation between peat functional integrity, disturbance and resilience(After Herrick et Wander 1998, modified & applied to peat) Modelling the C-N microbial biomass vs age of regeneration (WP I results)
600 2,0 Drained peatlands + NPKCa Fertilized peatlands Decreasing « source » function (South Massif central) (East Massif central) 1,5 Index 400 Aerial biomass (g DM m-2) 1,0 Ref Increasing « source » function Pastured peatlands 200 (Somme floodplain) CO2 efflux (g m-2 h-1) 0,5 C/N sol Natural Sphagnum mires (East Massif central) Index = 0,19 (CO2)-2,42 (R2 = 0,92) 0,0 0 1,0 0,2 0,4 0,6 0,8 Biomass = 10713 (C/N)-1,18 ; R2 = 0,52 …. or looking for thresholds : 0 10 20 30 40 50 - left graph different stages (--) of recovering process by refering (Ref) to a known «natural ecosystem» ; - right graph step by step way to define the « O » level beyond we recover the function (+ values of index) or not (- values) ( ex : C sink-source function in peatlands) D20-21 - Modelling CO2-CH4-MB potential ratios : Towards other Deliverables in the research of ecological indicators of peat regeneration …. Regeneration index and CO2 emissionin North France peatlands Disturbance, resilience, regeneration …. Relation aerial vegetal biomass vs C/N soil ratio in French peatlands
Higher diversity of plant communities high N microbial biomass High dominance of one species in the plant communities low N microbial biomass D20-21 - Modelling CO2-CH4-MB potential ratios : Towards other Deliverables in the research of ecological indicators of peat regeneration …. Microbial community functioning vs secondary succession Earlier stages of secondary succession on bare peat 1-10 years after abandonment of extraction Older stages of secondary succession on bare peat 10-50 years after abandonment of extraction
D20-21 - Modelling CO2-CH4-MB C potential ratios …. Towards other Deliverables in the research of ecological indicatorsof peat regeneration Signicant but R2 too low (0.1) … A little bit better ? C sequestration and new acrotelmic peat forming Relating organic chemistry and microbiological variables, not so simple : 2) A new horizon : applying the Clymo ’s model to acrotelm regeneration Considering pa = input of dry matter in the peat, a the decomposition rate : dx/dt = pa - a x with the following solution : x pa /a (1 - e- at) = accumulated peat
Concluding remarks • (1) Microbiological variables and ratios : • Microbial biomass C or N : signifcant responses with plant community and regeneration age ; • Ratios such as Carbon Turnover also show along the gradient of regeneration stages • CH4/CO2 ratios (potential activity) : not enough sensitive as a regeneration index in our experiment • (2) Modelling kinetics • CO2 kinetics in laboratory (potential activity) : classical fitness to a simple model (one compartment in most of kineticss, sometimes two) • (3) Need to be completed : • Use of Clymo’s model of accumulation with results of production and decomposition in Le Russey (WP III) • Further investigation in coupling organic chemistry and blobal microbial variables (will be done in July) • Relationships between kinetics of CO2-CH4 in lab with structure of microbial communities
Additionnal slides …. 1 - Results on litter (WP III -Ecobio) 2 - 3 - 4 - Theoterical considerations
13C - 15N Litter – Lab exp. WP III Litter decomposition : - kinetics of dry matter, C/N Microbial biomass in the peat columns : - calculation of 15N and 13 C recovery in progress - labeled 15N found in unfumigated and fumigated extract, in N mineral extract too - 13C-15N deltas
Diagrammatic representation Geology Hydrology Climat Biology … Potential Carbon sequestration level Defining factors Attainable Aeration Temperature Nutrients … Limiting factors Actual Drainage Extraction Erosion … Reducing factors Restoration measures + - 0 Peat decomposition/accumulation process : source vs sink function
t t + 1 Engineering resilience : Recovery time 1) How quickly a system recovers from disturbance Evolution of the concept of resilience over the laste 2 decades (from Gunarson 2000 in Groffman et al. 2006) Ecological resilience : Amount of disturbance to change scale 2) What amount of disturbance necessary to change the ecosystem state A B
Criteria for ecological indicators (after Dale & Beyeler (2001) are easily measured are sensitive to stress on system respond to stress in a predictable manner are anticipatory : signify an impending change in the ecological system predict changes that can be averted by management actions are integrative : the full suite of indicators provides a measure of coverage of the key gradients across the ecological systems (e.g. soils, vegetatyion types, temperature, etc.) have a known response to natural disturbances, anthropogenic stresses, and change over time have low variability in response
Indicator IMPACT With management Without management Implantation Time Diagrammatic representation of an impact quantified from an environmental indicator x. Quantification of an impact (André et al. 2000, modified)