Download
1 / 37
390 likes | 594 Views
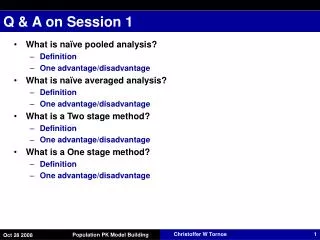
Q & A on Session 1. What is naïve pooled analysis? Definition One advantage/disadvantage What is naïve averaged analysis? Definition One advantage/disadvantage What is a Two stage method? Definition One advantage/disadvantage What is a One stage method? Definition

E N D
Q & A on Session 1 • What is naïve pooled analysis? • Definition • One advantage/disadvantage • What is naïve averaged analysis? • Definition • One advantage/disadvantage • What is a Two stage method? • Definition • One advantage/disadvantage • What is a One stage method? • Definition • One advantage/disadvantage Population PK Model Building
Between Subject Variability Residual Variability (Individual-Pop Mean CL,V) - Pred-Obs Conc + 0 - + 0 Q & A on Session 1: Mixed-effects concept ith patient ??? ??? Pop Avg Between-occasion variability = zero Population PK Model Building
- - + + 0 0 Posterior Posterior Q & A on Session 1: Bayes theorem - - + + 0 0 Current Prior - - + + 0 0 Prior Current Population PK Model Building
SD True CV True Q & A on Session 1: Residual variability models • Variability (SD) is same at low and high true values • Called “additive” model • Variability (SD) increases with true values • Called “proportional” or “constant CV” model SD True Population PK Model Building
Q & A Homework Assignment 3 • Why is it S2=V/1000 for homework 3 and S1=V/1000 for homework 2? • In homework 3, which of the following would not work? And if it works, what changes will have to made to the code? • VC=THETA(2)*EXP(ETA(2)) • V=THETA(1)*EXP(ETA(1)) and CL=THETA(2)*EXP(ETA(2)) • CL=TVCL*EXP(ETCL) • If the drug in homework 3 followed a two compartment model, what changes will you make to the code? • Is it necessary to include $COVARIANCE block in every run? • What do you specify in $OMEGA block? Population PK Model Building
Q & A Homework Assignment 3 • Where do the initial estimates of (theta), omega and sigma come from? • Is there a difference between the omega and sigma estimates in the *.smr and *.lst output files? • What is F and Y in $ERROR? • What does the NOAPPEND do? Population PK Model Building
Population PK Model Building Christoffer W Tornoe Pharmacometrics Office of Clinical Pharmacology Food and Drug Administration Population PK Model Building
Agenda • Population PK Model Building • Model based inference • Hypothesis testing • Likelihood ratio test • Base model selection (not the focus of this session) • Covariate model building • Continuous covariates • Discrete covariates • Covariate search methods • Model Qualification and Assumption Checking • Likelihood profiling • Introduction and application of bootstrap to derive confidence intervals • Parametric and non-parametric • Posterior predictive check and predictive check • Internal and external validation • Sensitivity analysis Population PK Model Building
Hypothesis testing • Wikipedia definition - A method of making statistical decisions using experimental data • In population PK modeling building, hypothesis testing is used to choose between competing models • Null-hypothesis • Assuming the null hypothesis is true (H0: q = q0), what is the probability of observing a value (c) for the test statistic (L) that is at least as extreme as the value that was actually observed? • Critical region of a hypothesis test is when the null hypothesis is rejected (L ≥ c, reject H0) and the alternative hypothesis (HA: q = qA) is accepted (L < c accept (don’t reject) H0) Population PK Model Building
Likelihood Ratio Test • Likelihood Ratio Test (LRT) is used to compare goodness-of-fit for nested models • Nested models: One model is a subset of the other, e.g. base model (without covariates) is a subset of the full model (with covariates) • CL= CLpop + slope* WT? • First-order elimination [CL*C] vs. Michaelis-Menten [Vmax*C/(C+Km)] ? • One-, two-, three-compartment model ? • Combined residual error model Y = IPRED*(1+EPS(1)) + EPS(2) ? • The ratio of likelihoods (L1/L2) can be used to test for significance • Objective Function Value (OFV) = - 2 log-likelihood, i.e. sum of squared deviations between predictions and observations • Distribution of -2 log(L1/L2) follows a 2 distribution • -2 log(L1/L2) = -2 (log L1 – log L2) = 2 (LL2 – LL1) • Difference in log likelihoods follows2 distribution Population PK Model Building
Likelihood Ratio Test • With a probability of 0.05, and 1 degree of freedom, the value of the 2 distribution is 3.84 Population PK Model Building
Other Information Criterions • Akaike Information Criterion (AIC) is another measure to compare goodness-of-fit between competing models • Lower AIC = better model fit to the data • AIC = - 2LL + 2*k where k = no. of model parameters • Bayesian Information Criterion (BIC or Schwarz) • Lower BIC = better model fit to the data • BIC = - 2LL + k*ln(nobs) where nobs = number of observations Which criterion penalizes the most for the number of parameters? Population PK Model Building
Population PK Model Building – Base Model • Base Model • Structural • Input (IV bolus, first-order absorption, zero-order input) • Distribution (one-, two-, three-compartment model) • Elimination (linear or non-linear) • Single/multiple dose • Between-subject variability • Individual PK estimates should be positive (i.e. CLi=CLpop*exp(hi)) • Residual variability • Additive (Constant residual error (LLOQ)) • Proportional (Increasing variability with increasing concentrations, CCV) • Combined Population PK Model Building
Methods for Assessing Goodness-of-Fit • Hypothesis Testing • Likelihood-ratio test (Compare OFV) • AIC, BIC • Precision of parameter estimates • Large standard errors indicate over-parameterization • Diagnostic plots • Observed and predicted concentration vs. time • Observed vs. predicted concentration • Residuals vs. time • Residuals vs. predictions Population PK Model Building
Covariate Model Building • Why build covariate models? • Explain between-subject variability in parameters and response using patient covariates • Improve predictive performance • Understand causes of variability • Patient covariates • Demographic (weight, age, height, gender, ethnicity) • Biomarkers (renal/hepatic function) • Concomitant medication (beta-blocker, CYP inhibitors) • Comorbidity (other diseases) Population PK Model Building
Different Ways to Implement Covariate Models • Continuous covariates • Linear • CL= CLpop + slope* WT • CL= CLpop + slope* (WT-WTpop) (Centered around population mean) • Piecewise linear • CL= CLpop + (WT<40)*slope1 * (WT) + (WT≥40)*slope2 * (WT) • Power • CLi = CLpop * WTiexponent (Allometric model: exponent=0.75) • CLi = CLpop * (WTi/WTpop)exponent (Normalized by population mean) • Exponential • CLi = CLpop * exp (slope*WTi) Population PK Model Building
Different Ways to Implement Covariate Models • Categorical covariates • Linear • CL= CLpop,female + Male_diff* SEX • Proportional • CL= CLpop,female * (1 + Male_diff* SEX) • Power • CL= CLpop,female * Male_diffSEX • Exponential • CL= CLpop,female * exp(Male_diff* SEX) (SEX = gender, 0 = Female, 1 = Male) Population PK Model Building
Covariate Model Building Essentials • Visualize the range and distribution of the covariate data • Identify strong correlations or co-linearities between covariates • Apply prior knowledge about the PK of the drug • Renally cleared drug (e.g. CL~CrCL) • Fix covariate parameters to literature value if they can’t be estimated (CL ~ WT 0.75, V ~ WT 1.0) • Keep clinical utility in mind when incorporating covariates • Use body weight instead of BSA as covariate for clearance when dosed mg/kg • Limit to clinical important covariates, e.g cause >20% difference • Consider study design before ruling out a covariate effect • Too narrow covariate range • Insufficient information to estimate effect (e.g. 95% CI includes 0) Population PK Model Building
Example • One-compartment model with 1-order absorption • 100 subjects • Samples at t=1, 2, 6, 8, 12, 16, and 24 hours postdose • Single dose of 50 mg Population PK Model Building
Visualization of Covariate Data Continuous Covariates Categorical Covariates Population PK Model Building
Identify Covariate Correlations or Co-Linearities • Body weight and age a co-linear • Body weight and sex are correlated Population PK Model Building
Clearance Model Building • Base Model Clearance ( CLi = CLpop * exp(hi) ) vs Body Weight • OFV: 8277 • Try linear model: CLi = (CLpop + slope* WTi ) * exp(hi) Population PK Model Building
Clearance Model Building • Covariate Model 1: CLi = (CLpop + slope* WTi ) * exp(hi) • DOFV = -30 (Base OFV = 8277, Cov1 OFV = 8247) • Correlation between CLpop and slope = -0.984 Population PK Model Building
Clearance Model Building • Covariate Model 2: CLi = (CLpop + slope* (WTi -70) * exp(hi) • Try centering around median body weight • DOFV = 0 (Cov1 OFV = 8247, Cov2 OFV = 8247) • Corr(CLpop, slope) = 0.307 Population PK Model Building
Clearance Model Building • Covariate Model 3: CLi = (CLpop* (WTi /70)exponent * exp(hi) • Try power model to avoid problems for WT = 0 • DOFV = 0 (Cov2 OFV = 8247, Cov3 OFV = 8247) Population PK Model Building
Clearance Model Building • Covariate Model 3: CLi = (CLpop* (WTi /70)exponent * exp(hi) • Look for other potential continuous clearance covariates • Clearance appears correlated with Age due to co-linearity with WT • IIV Clearance does not show a trend with Age Population PK Model Building
Clearance Model Building • Covariate Model 3: CLi = (CLpop* (WTi /70)exponent * exp(hi) • Look for other potential categorical clearance covariates • Higher clearance in males compared to females – Why? Population PK Model Building
Clearance Model Building • Covariate Model 3: CLi = (CLpop* (WTi /70)exponent * exp(hi) • Females have lower body weight compared to males • No trend in ETA CL Population PK Model Building
Covariate Search Methods • Generalized Additive Modeling (GAM) • Multiple linear regression to quickly screen for linear and non-linear covariate-parameters relationships • Based on empirical Bayes parameter estimates from NONMEM • Does not account for correlation between model parameters • Stepwise Covariate Modeling (SCM) • Forward addition • Backward elimination • Forward/backward stepwise Population PK Model Building
Generalized Additive Modeling (GAM) • Implemented in Xpose4 in R • Clearance covariate model (Revisited) • xpose.gam(xp0, parnam="CL", covnams = xvardef("covariates", xp0)) • Initial Model: CL ~ 1 • Final Model: CL ~ BW • Call: gam(formula = CL ~ BW, data = gamdata, trace = FALSE) • Deviance Residuals: • Min 1Q Median 3Q Max • -0.99254 -0.37352 -0.02943 0.32620 1.32247 • (Dispersion Parameter for gaussian family taken to be 0.293) • Null Deviance: 38.0509 on 99 degrees of freedom • Residual Deviance: 28.7098 on 98 degrees of freedom • AIC: 164.9947 • Coefficients • (Intercept) BW • 0.08806173 0.02200286 http://xpose.sourceforge.net http://cran.r-project.org Population PK Model Building
Generalized Additive Modeling (GAM) Population PK Model Building
Stepwise Covariate Modeling (SCM) • Implemented in Perl-Speaks-NONMEM • Forward Inclusion Step • Includes covariates one step at a time using LRT (typically p<0.05) • Univariate analysis of all specified covariate-parameter relationships • Adds best covariate and repeats univariate analysis with remaining covariates • Continue until no more significant covariates are left • Backward Elimination Step • Starts with final model in forward inclusion step and removes covariates one at a time in a stepwise manner using LRT (typically p<0.01 or p<0.001) • Remove covariate that has the smallest increase in OFV when fixed to 0 • Continues until all remaining covariates are significant http://psn.sourceforge.net Population PK Model Building
Stepwise Covariate Modeling (SCM) • Forward inclusion (p<0.05), Backward eliminition (p<0.001) • Continuous (Age, BW, Exponential=4) and Categorical (Sex, Linear=2) 1. Forward Step Population PK Model Building
Stepwise Covariate Modeling (SCM) • Forward inclusion (p<0.05), Backward eliminition (p<0.001) • Continuous (Age, BW, Exponential=4) and Categorical (Sex, Linear=2) 2. Forward Step Population PK Model Building
Stepwise Covariate Modeling (SCM) • Forward inclusion (p<0.05), Backward eliminition (p<0.001) • Continuous (Age, BW, Exponential=4) and Categorical (Sex, Linear=2) 3. Forward Step Population PK Model Building
Stepwise Covariate Modeling (SCM) • Forward inclusion (p<0.05), Backward eliminition (p<0.001) • Continuous (Age, BW, Exponential=4) and Categorical (Sex, Linear=2) 1. Backward Step Population PK Model Building
Summary of Covariate Model Building • Why build covariate models? • Explain between-subject variability in parameters and response using patient covariates • Improve predictive performance • Understand causes of variability • Before building covariate models • Apply prior knowledge about the PK of the drug when deciding on which covariates to test • Keep clinical utility in mind when incorporating covariates • Consider whether the available data and design is adequate to detect covariate effect • Covariate search methods • Generalized additive modeling • Stepwise covariate modeling Population PK Model Building