Abstract:
10 likes | 168 Views
A direct carbon budgeting approach to infer carbon sources and sinks from the NOAA/ESRL Aircraft Network

Abstract:
E N D
Presentation Transcript
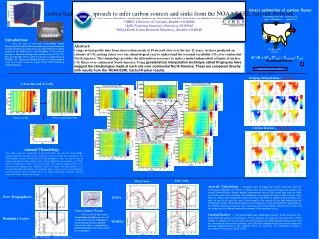
A direct carbon budgeting approach to infer carbon sources and sinks from the NOAA/ESRL Aircraft Network Colm Sweeney1, Cyril Crevoisier2, Wouter Peters1, Aaron Watson1, Sarah Peterson1, Doug Guenther1, Don Neff1, Patricia Lang3, Steve Montzka3, Pieter Tans3, Sonja Wolter1 1CIRES, University of Colorado, Boulder CO 80304 2AOS, Princeton University, Princeton, NJ 08544 3NOAA Earth System Research Laboratory, Boulder CO 80305 Direct estimation of carbon fluxes Exchanges with the upper atmosphere (convection, advection) h Out Introduction: Over the past 12 years the NOAA/ESRL Global Monitoring Division has been maintaining an aircraft network to make discrete measurements of air from 500 meters above ground to the 8000 meters. The backbone of the aircraft network is the flask packages that enable analysis CO2, CO, SF6, N2O, H, CH4, 13CO2, and C18O2 of all at a common lab in Boulder, CO. At present, roughly 18 sites are being sampled every two to three weeks as a part of the North American Carbon Program. Abstract: Using vertical profile data from observations made at 19 aircraft sites over the last 12 years, we have produced an estimate of CO2 mixing ratios over one climatological year to understand the seasonal variability CO2 over continental North America. The climatology provides the information necessary to make a model-independent estimate of surface CO2 fluxes over continental North America. Using geostatistical interpolation technique called Kriging we have mapped the climatologies made at each site over continental North America. These are compared directly with results from the NOAA/ESRL CarbonTracker results. In Surface CO2 fluxes dC/dt = (Fhin-Fhout) - Fvertical+ Fsurf ? Observations aircrafts + towers. Kriging interpolation –850 mbar 6 Year Record at CAR 6 Years at CAR 6 Years at detrended CAR CarbonTracker - 850 mbar Annual Climatology This study is the first compilation of all the data CO2 data from the NOAA/ESRL Aircraft Network. In order to take advantage of the fact that data collected in the NOAA/ESRL Aircraft Network has been discontinued at some sites due to lack of funding and logistics all measurements have been adjusted to one common year (2004) using the Mona Loa surface site measurements. The annual climatology has been constructed by binning each “adjusted” profile by month. The final product is an annual climatology that reflects measurements from as many years as aircraft profiles have been done at that site. Black dots in the annual climatology show the sampling density that makes up the climatology. 0 -6 East Coast West Coast Aircraft Climatology –Boundary layer averages are shown solid lines and free troposphere estimates are shown in dotted lines. Both aircraft climatology (top panels) and model (CarbonTracker, bottom panels) demonstrate lags at East coast sites and not West coast sites which are consistent. The amplitude of the seasonal cycle at sites such as Cape May, NJ (CMA), New Hampshire (NHA) and Poker Flat (PFA) is slightly underestimated. This may be due to the grid box size of the model or the scarcity of the data making up the climatology. Similar observations extend to the comparison of the geostatistical interpolation of the monthly climatology from the data compared with CarbonTracker (above) which show that the model may be underestimating the extremes in the seasonal cycles. 2 Month Lag Free Troposphere: DATA Cross Country Trends: Western marine sites such as Trinidad Head and Hawaii are well correlated to with free troposphere measurements. Eastern and mid-western sites show a ~2 months lag between boundary layer sites and the free troposphere. CarbonTracker –The NOAA/ESRL data assimilation system, which estimates CO2 fluxes and atmosphere concentrations. These estimate are optimally consistent with 14,000 weekly air samples of CO2from sites across the globe, 5,000 daily average mixing ratios from our observatories around the continent, and 5,000 daily average mixing ratios from continuous tall-tower measurements at four locations within the continent. The assimilation system is described in Peters et al., [2004, 2005] Boundary Layer: MODEL Solid – West Coast Dashed – East Coast