Understanding Spatial Pattern Analysis in Ecology: Structure, Function, and Change
This document explores the intricate relationships within spatial pattern analysis, focusing on ecological structure, function, and change. It delves into spatial metrics such as composition, configuration, and the various classifications and metrics used to assess ecological landscapes. Key concepts include the analysis of patch density, shape complexity, fractal dimensions, and diversity metrics. By examining these parameters, we aim to understand ecological interactions and how they influence ecosystem dynamics over time, providing insights for sustainable environmental management.


Understanding Spatial Pattern Analysis in Ecology: Structure, Function, and Change
E N D
Presentation Transcript
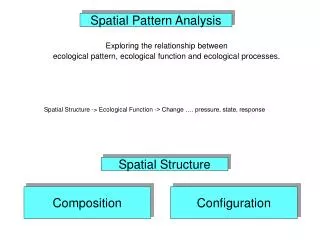
Spatial Pattern Analysis Exploring the relationship between ecological pattern, ecological function and ecological processes. Spatial Structure -> Ecological Function -> Change …. pressure, state, response Spatial Structure Composition Configuration
Assess Pattern Input = classified input Output = spreadsheet of selected metrics
Spatial Structure • Composition = The presence and amount of each element type without spatially explicit measures. • Proportion, richness, evenness, diversity • Configuration = The physical distribution in space and spatial character of elements. • Isolation, placement, adjacency
Rugosity Jeff Jenness and Pat Iampietro
Histogram Classification 1 band, Red wavelength Multi 3 band “true color” Red, Green, Blue; 5 class, “isodata” R,G,B,IR original continuous data Various histogram classification results 5 class Natural breaks Jenk’s classifier 5 class Equal Interval equal-sized sub-ranges 11 class (1/2 equal Interval) Defined Interval An interval which equally Divides a range 5 class Quantile Each class has equal Number of features 5 class Quantile 1 standard deviation
Clustering Multivariate Spatial Data
Inner radius Outer radius
Classification Ridge Upper Slope Middle Slope Flat Lower Slope Valley
1 “landscape” 3 “patches” Same “class” 1 “patches” differ “class”
Types of Metrics • Area, Density, Diversity • Shape • Core area • Isolation/proximity, Nearest-Neighbor • Contrast metrics • Contagion / Interspersion • Connectivity • Diversity
Area, Density, Diversity Metrics Shannon Diversity Index Patch Density
Shape Metricsperimeter-area relationships Fractal: a pattern composed of identical parts
E = total edge A = total area • Fractal Dimension (D), or (FRACT) • - log P = 1/2D*log A; P = perimeter, A = area • Shape Index (SHAPE) -- complexity of patch compared to standard shape • vector uses circular; raster uses square • Mean Shape Index (MSI) = perimeter-to-area ratio • Area-Weighted Mean Shape Index (AWMSI) • Landscape Shape Index (LSI) fractal dimension indicates the extent to which the fractal object fills the Euclidean dimension
M = number of classes Eik = length of edge between classes Contagion, Interspersion and Juxtaposition • When first proposed (O’Neill 1988) proved incorrect, Li & Reynolds (1993) alternative • Based upon the product of two (2) probabilities • Randomly chosen cell belongs to patch “i” • Conditional probability of given type “i” neighboring cells belongs to “j” • Interspersion (the intermixing of units of different patch types) and Juxtaposition (the mix of different types being adjacent) index (IJI)
4 5 19 32 13 89 1.45 1.85 ? .69 1.10 ? 30.2 40 ? ? ? ? ? 27 3 4 1.5 4 2 .25 1.12 69 5 4 1.87 10 2 0 1.30 1 1 0 1 89 1 0 1.60 Landscape Metrics Number of Patches 1 Largest Patch 100 Area-weighted mean shape 1 Shannon’s Diversity 0 Interspersion 0 Class Metrics Percent of Landscape | Patch Density | Patch Size CV | Area-weighted Mean Shape
Landscape Ecology • Structure = the spatial relationships among the distinctive ecosystems or “elements” • Function = the interactions among the spatial elements • Change = the alteration in the structure and function of the ecological mosaic over time
Landscape Structure Physiognomy / Pattern • Composition = The presence and amount of each element type without spatially explicit measures. • Proportion, richness, evenness, diversity • Configuration = The physical distribution in space and spatial character of elements. • Isolation, placement, adjacency • ** some metrics do both **
Types of Metics • Area Metrics • Patch Density, Size and Variability • Edge Metrics • Shape Metrics • Core Area Metrics • Nearest-Neighbor Metrics • Diversity Metrics • Contagion and Interspersion Metrics
Shape Metricsperimeter-area relationships • Shape Index (SHAPE) -- complexity of patch compared to standard shape • vector uses circular; raster uses square • Mean Shape Index (MSI) = perimeter-to-area ratio • Area-Weighted Mean Shape Index (AWMSI) • Landscape Shape Index (LSI) • Fractal Dimension (D), or (FRACT) • log P = 1/2D*log A; P = perimeter, A = area • P = sq.rt. A raised to D, and D = 1 (a line) • as polygons move to complexity P = A, and D -> 2 • A few fractal metrics • Double log fractal dimension (DLFD) • Mean patch fractal (MPFD) • Area-weighted mean patch fractal dimension (AWMPFD)
Contagion, Interspersion and Juxtaposition • When first proposed (O’Neill 1988) proved incorrect, Li & Reynolds (1993) alternative • Based upon the product of two (2) probabilities • Randomly chosen cell belongs to patch “i” • Conditional probability of given type “i” neighboring cells belongs to “j” • Interspersion (the intermixing of units of different patch types) and Juxtaposition (the mix of different types being adjacent) index (IJI)