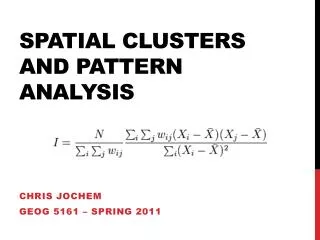
Spatial Clusters and Pattern Analysis
Spatial Clusters and Pattern Analysis. Chris Jochem Geog 5161 – Spring 2011. When you know ‘where’, you can start to ask ‘why’. John Snow’s map of cholera deaths in London, 1854. Need to move beyond simply mapping events and beyond general point pattern analysis. Water pump locations.

Spatial Clusters and Pattern Analysis
E N D
Presentation Transcript
Spatial Clusters and Pattern Analysis Chris Jochem Geog 5161 – Spring 2011
When you know ‘where’, you can start to ask ‘why’ John Snow’s map of cholera deaths in London, 1854. Need to move beyond simply mapping events and beyond general point pattern analysis. Water pump locations
Goals of Cluster Analysis • Examine “unusual” groupings of events in space and/or time (Cromley and McLafferty 2002) • Both confirmatory and exploratory of hypotheses • Different ways to operationalize unusual or unexpected patterns using probability distributions • Common Questions (Waller and Gotway 2004, 155): • Do cases tend to occur near other cases? (possible infectious agent) • Does a particular area within the study region seem to contain a significant excess of observed events? (possible environmental risk factor) • Where are the most unusual collection of cases? (possible cluster)
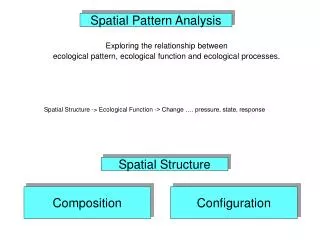
Different Methodologies … for different levels of analysis Point Pattern Analysis: density and distance measurements • Ex: density map of cholera cases Clustering requires different statistical tests • often used sequentially or as part of a larger study to select areas for more detailed field work. • Three main categories of tests: • Global • Local • Focal
3 main Categories of Tests • Global: a single test for general patterns and spatial autocorrelation over an entire study region • Moran’s I • Geary’s C • Local: search for specific regions or areas where clustering is observed above expected levels • Example: areas of high crime or terrorist attacks • Local Moran’s I • Getis-OrdGi* • Spatial Scan Statistic • Focal: specialized statistics searching only in regions around fixed locations • Example: cancers around nuclear reactors • Stone’s Test • Bithell • Tango
Consider your Data • Point Data • Events (diseases crimes, conflicts, etc.) • Cases/Controls • Measurement locations • Considerations • Point level accuracy • Polygon Data • Census or social attributes (poverty, unemployment, income, etc.) • Aggregate counts of individual-level events • Considerations • Modifiable areal unit problem (MAUP)
Spatial Scan Statistic • As implemented in SatScan® software • Input point or area data for events and background population, can vary over time • Pass a circular or elliptical filter of varying radii across study area • Count observed cases and test likelihood ratio against expected cases given the population or person-time Pros Cons Spatial, temporal, or space-time clusters Controls for risk factors and covariates Learning curve for set-up and interpretation No graphical output
Examples • O’Loughlin, John and Frank D. W. Witmer. 2011. The Localized Geographies of Violence in the North Caucasus of Russia, 1999-2007. The Annals of the Association of American Geographers 101, no. 1 (January): 178 – 201. Using a spatial scan statistic to find local clusters of conflicts in space and time.
Examples • Kulldorff M, Athas W, Feuer E, Miller B, Key C. Evaluating cluster alarms: A space-time scan statistic and brain cancer in Los Alamos. American Journal of Public Health, 1998; 88:1377-1380. • See the demo! • Many additional examples: http://www.satscan.org/references.html
Considerations and Critiques • Must consider data limitations and accuracies • How do you define a ‘cluster’? expected outcomes • Possibility of occurring by chance, especially with small numbers • Based on theory or hypothesized relationships “Texas Sharpshooter Fallacy”
Considerations and Critiques • Must consider underlying population at risk • People are not evenly distributed • Complete spatial randomness is usually not valid • Difficult to link causality to clusters (Elliot et al. 2000, Elliot and Wakefield 2001) • Usually requires further studies • What matters is scientific, not statistical, significance (Gould 1970) • See also O’Sullivan and Unwin (2003), and Harvey (1966,1967)
Resources • Free Software: • SatScan: http://www.satscan.org/ • CrimeStat: http://www.icpsr.umich.edu/CrimeStat/ • GeoDa: http://geodacenter.asu.edu/projects/opengeoda • R packages: http://cran.r-project.org/web/views/Spatial.html • Broad Street Cholera Data: http://www.asdar-book.org/datasets.php?dataset=4
References • Anselin, Luc. 2006. How (not) to lie with spatial statistics. American Journal of Preventive Medicine 30: s3-s6. • Cromley, Ellen K. and Sara L. McLafferty. 2002. GIS and Public Health. New York: Guilford Press. • Elliott, Paul and Jon Wakefield. 2001. Disease clusters: Should they be investigated, and, if so, when and how? Journal of the Royal Statistical Society A 164, 1: 3-12. • Elliott, Paul, Jon Wakefield, Nicola Best, and David Briggs. 2000. Spatial Epidemiology: Methods and Applications. Oxford University Press. • Gould, Peter. 1970. Is statistixinferens the geographic name for a wild goose? Economic Geography 46 (June): 439-448. • Harvey, David W. 1966. Geographical processes and the analysis of point patterns: Testing models of diffusion by quadrat sampling. Transactions of the Institute of British Geographers 40: 81-95. • Harvey, David W. 1967. Some methodological problems in the useofNeyman type A and negative binomial distribution for the analysis of point patterns. Transactions of the Institute of British Geographers 44: 81-95.
References • Kulldorff, Martin, and Neville Nagarwalla. 1995. Spatial disease clusters: Detection and inference. Statistics in Medicine 14: 799-810. • Kulldorff, Martin, W. Athas, E. Feuer, B. Miller, and C. Key. 1998. Evaluating cluster alarms: A space-time scan statistic and brain cancer in Los Alamos. American Journal of Public Health 88:1377-1380. • Kulldorff, Martin. 1997. A spatial scan statistic. Communications in Statistics – Theory and Methods 26, no. 6: 1481-1496. • Kulldorff, Martin. and Information Management Services, Inc. SaTScanTM v8.0: Software for the spatial and space-time scan statistics. http://www.satscan.org/, 2009. • O’Loughlin, John and Frank D. W. Witmer. 2011. The Localized Geographies of Violence in the North Caucasus of Russia, 1999-2007. The Annals of the Association of American Geographers 101, no. 1 (January): 178 – 201. • O’Sullivan, David and David J. Unwin. 2003. Geographic Information Analysis. Hoboken, New Jersey: John Wiley and Sons. • Olsen, Sjurdur F., Marco Martuzzi, and Paul Elliott. 1996. Cluster analysis and disease mapping – why, when, and how? A step by step guide. British Medical Journal 313 (October): 863-866. • Waller, Lance A. and Carol A. Gotway. 2004. Applied Spatial Statistics for Public Health Data. Hoboken, New Jersey: John Wiley and Sons.
Spatial Clusters and Pattern Analysis Chris Jochem Geog 5161 – Spring 2011