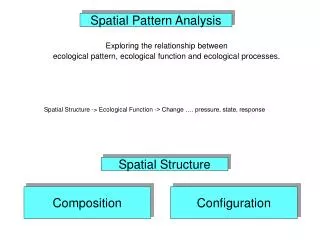
Spatial Analysis
Spatial Analysis. gis@umd.edu University of Maryland, College Park 2013. Workshop Outline. Presentation Exercises Creating shapefiles Five Common ArcToolbox Tools Spatial Analysis with raster data Questions and concerns?. Vector Data Review. point attribute table line


Spatial Analysis
E N D
Presentation Transcript
Spatial Analysis gis@umd.edu University of Maryland, College Park 2013
Workshop Outline • Presentation • Exercises • Creating shapefiles • Five Common ArcToolbox Tools • Spatial Analysis with raster data • Questions and concerns?
Vector Data Review point attribute table line polygon
Raster Data Review cells attribute table (or not) raster properties
Analysis in GIS • With vector data, the GIS uses values from fields in the attribute table • With raster data, the GIS uses values from individual cells, or performs calculations based on zones and/or regions.
More on Raster Data • Two types of raster data: • Thematic • A measured quantity or a classification • Ex: 5=elevation in feet • Ex: 5=water; 3=forest • Image • Reflected or emitted light • Ex: Pixel scale from 0 to 255 where 0 is black and 255 is white
Raster Datasets • Usually represent a single theme (elevation, land use, etc.) – so you need several to show an area • Are made up of individual cells – cells either have a value or have no data
Raster Datasets - Cells • Cells can be any size, but every cell in the dataset is the same size. • The smaller the cell size, the greater the resolution. • Cells are arranged in rows and columns, so each one has a specific address.
More on Cells Zones • formed by two or more cells with the same value (connected or disconnected) Zone 1 consists of 7 cells Regions • group of connected cells in a zone Zone 1 has 2 regions
Data Types (Layers) • Raster/Grid DEM Digital Elevation Model Image (raster) where the pixel values represent the ground elevation above sea level DTM Digital Terrain Model Image (raster) a DTM is a DEM that has been altered by elements such as break lines and observations to correct for artifacts by using photogrammetrically derived line work introduced into a DEM surface. DSM Digital Surface Model Image (raster) where the pixel values represent the elevations above sea level of the ground and all features on it. For example if there are buildings in the area, the DSM will include those building in the elevation values
Projections and Coordinate Systems • Geographic coordinate system (GCS) • Location on a sphere (latitude-longitude) • http://egsc.usgs.gov/isb//pubs/MapProjections/projections.html • Datum (goes along with the GCS) • Horizontal datums are calculated using a mathematical calculation for the approximation of the shape of the earth, known as an ellipsoid. Most ellipsoids are calculated for a geographic region such as North America • GPS units use the WGS 1984 datum • Projected coordinate system • Location on a flat map from a defined 0,0 origin • Has an underlying GCS
Projections ctd. • A map projection distorts one or more of the following: • Distance • Shape • Area • Direction • Reference website: http://egsc.usgs.gov/isb//pubs/MapProjections/projections.html • Reference books: Flattening the earth: two thousand years of map projections / John P. Snyder An Album of Map Projections (USGS Professional Paper 1453) / John P. Snyder and Philip M. Voxland http://pubs.usgs.gov/pp/1453/report.pdf
GIS Analysis – A Process Define the problem/issue/question Get Data Evaluate Result What data do you need? Is the methodology sound? Where will you get it? Is the question answered? Are there any new questions? Evaluate Data Is this data in a usable format? Projection? Appropriate fields? Quality of the data? Metadata? Final Formatting Who is the audience/what is the purpose? How should results be displayed? Perform analysis Present Final Result What is your methodology? What tools should you use?
GIS is just a tool • Quality of your data • Quality of your modeling process • Quality of your analysis • Aesthetics
Learning more GIS and background • GEOG 373 – Geographic Information Systems • GEOG 473 – Geographic Information Systems and Spatial Analysis • GEOG 306 – Introduction to Quantitative Methods for the Geographic Environmental Sciences • Virtual Campus Courses • Learning ArcGIS Desktop • Understanding Map Projections and Coordinate Systems • Working with Rasters in ArcGIS Desktop
Class Assessment Please complete this! It’s quick and helps us improve the workshops. http://ter.ps/4ot