Spatial Pattern Analysis
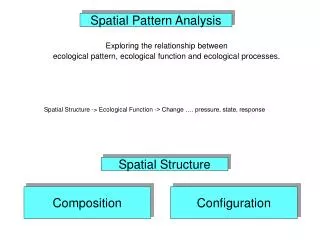
Spatial Pattern Analysis. Exploring the relationship between ecological pattern, ecological function and ecological processes. Spatial Structure -> Ecological Function -> Change …. pressure, state, response . Spatial Structure. Composition. Configuration. www.mosaicr.com.

Spatial Pattern Analysis
E N D
Presentation Transcript
Spatial Pattern Analysis Exploring the relationship between ecological pattern, ecological function and ecological processes. Spatial Structure -> Ecological Function -> Change …. pressure, state, response Spatial Structure Composition Configuration
Assess Pattern Input = classified input Output = spreadsheet of selected metrics
Spatial Structure • Composition = The presence and amount of each element type without spatially explicit measures. • Proportion, richness, evenness, diversity • Configuration = The physical distribution in space and spatial character of elements. • Isolation, placement, adjacency
Rugosity Jeff Jenness and Pat Iampietro
Histogram Classification 1 band, Red wavelength Multi 3 band “true color” Red, Green, Blue; 5 class, “isodata” R,G,B,IR original continuous data Various histogram classification results 5 class Natural breaks Jenk’s classifier 5 class Equal Interval equal-sized sub-ranges 11 class (1/2 equal Interval) Defined Interval An interval which equally Divides a range 5 class Quantile Each class has equal Number of features 5 class Quantile 1 standard deviation
Clustering Multivariate Spatial Data
Inner radius Outer radius
Classification Ridge Upper Slope Middle Slope Flat Lower Slope Valley
1 “landscape” 3 “patches” Same “class” 1 “patches” differ “class”
Types of Metrics • Area, Density, Diversity • Shape • Core area • Isolation/proximity, Nearest-Neighbor • Contrast metrics • Contagion / Interspersion • Connectivity • Diversity
Area, Density, Diversity Metrics Shannon Diversity Index Patch Density
Shape Metricsperimeter-area relationships Fractal: a pattern composed of identical parts
E = total edge A = total area • Fractal Dimension (D), or (FRACT) • - log P = 1/2D*log A; P = perimeter, A = area • Shape Index (SHAPE) -- complexity of patch compared to standard shape • vector uses circular; raster uses square • Mean Shape Index (MSI) = perimeter-to-area ratio • Area-Weighted Mean Shape Index (AWMSI) • Landscape Shape Index (LSI) fractal dimension indicates the extent to which the fractal object fills the Euclidean dimension
M = number of classes Eik = length of edge between classes Contagion, Interspersion and Juxtaposition • When first proposed (O’Neill 1988) proved incorrect, Li & Reynolds (1993) alternative • Based upon the product of two (2) probabilities • Randomly chosen cell belongs to patch “i” • Conditional probability of given type “i” neighboring cells belongs to “j” • Interspersion (the intermixing of units of different patch types) and Juxtaposition (the mix of different types being adjacent) index (IJI)
4 5 19 32 13 89 1.45 1.85 ? .69 1.10 ? 30.2 40 ? ? ? ? ? 27 3 4 1.5 4 2 .25 1.12 69 5 4 1.87 10 2 0 1.30 1 1 0 1 89 1 0 1.60 Landscape Metrics Number of Patches 1 Largest Patch 100 Area-weighted mean shape 1 Shannon’s Diversity 0 Interspersion 0 Class Metrics Percent of Landscape | Patch Density | Patch Size CV | Area-weighted Mean Shape
Landscape Ecology • Structure = the spatial relationships among the distinctive ecosystems or “elements” • Function = the interactions among the spatial elements • Change = the alteration in the structure and function of the ecological mosaic over time
Landscape Structure Physiognomy / Pattern • Composition = The presence and amount of each element type without spatially explicit measures. • Proportion, richness, evenness, diversity • Configuration = The physical distribution in space and spatial character of elements. • Isolation, placement, adjacency • ** some metrics do both **
Types of Metics • Area Metrics • Patch Density, Size and Variability • Edge Metrics • Shape Metrics • Core Area Metrics • Nearest-Neighbor Metrics • Diversity Metrics • Contagion and Interspersion Metrics
Shape Metricsperimeter-area relationships • Shape Index (SHAPE) -- complexity of patch compared to standard shape • vector uses circular; raster uses square • Mean Shape Index (MSI) = perimeter-to-area ratio • Area-Weighted Mean Shape Index (AWMSI) • Landscape Shape Index (LSI) • Fractal Dimension (D), or (FRACT) • log P = 1/2D*log A; P = perimeter, A = area • P = sq.rt. A raised to D, and D = 1 (a line) • as polygons move to complexity P = A, and D -> 2 • A few fractal metrics • Double log fractal dimension (DLFD) • Mean patch fractal (MPFD) • Area-weighted mean patch fractal dimension (AWMPFD)
Contagion, Interspersion and Juxtaposition • When first proposed (O’Neill 1988) proved incorrect, Li & Reynolds (1993) alternative • Based upon the product of two (2) probabilities • Randomly chosen cell belongs to patch “i” • Conditional probability of given type “i” neighboring cells belongs to “j” • Interspersion (the intermixing of units of different patch types) and Juxtaposition (the mix of different types being adjacent) index (IJI)