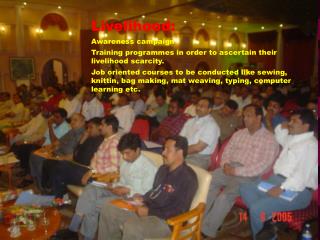
Livelihood and Mobility Interconnections
This analysis explores the intricate relationships between mobility and livelihoods, emphasizing how access and transport infrastructure influence economic and social opportunities. It highlights the differentiated mobility experiences across income strata, particularly for low-income groups facing relative immobility. The study includes data on transport assets, daily travel patterns, and the role of mobility in various sectors. Policy recommendations focus on enhancing accessibility and addressing the mobility needs of different localities to promote efficient movement and equitable economic growth.

Livelihood and Mobility Interconnections
E N D
Presentation Transcript
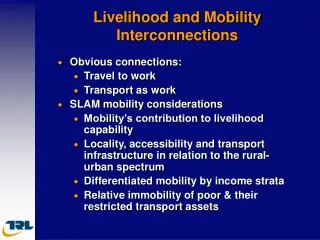
Livelihood and Mobility Interconnections • Obvious connections: • Travel to work • Transport as work • SLAM mobility considerations • Mobility’s contribution to livelihood capability • Locality, accessibility and transport infrastructure in relation to the rural-urban spectrum • Differentiated mobility by income strata • Relative immobility of poor & their restricted transport assets
Livelihoods and Mobility • Types of mobility • Residential • Settlement timing • Locational flexibility • Daily Short-distance • Distance to work vis-à-vis formal & informal work • Modal choice - influences travel time and speed • Annual long-distance • Importance of social visits
Mobility and the Capital Asset Pentagon • Trade-offs with respect to Livelihoods, Access and Mobility
Mobility and the Capital Asset Pentagon • Social Capital Asset Trade-offs
Mobility and the Capital Asset Pentagon • Financial Capital Assets and Transport Investment
Conceptualising Livelihoods & Mobility in the SLAM Project • Importance of access and mobility to the generation of economic & non-economic activities (including social visits) • Livelihoods analysis facilitated a multi-sectoral investigation of mobility with respect to: • Social services • Formal and informal work • Social capital pursuits • Mobility and work patterns are highly income-differentiated which must be addressed in poverty alleviation
Indices of Relative Immobility: Low- and Medium-Income Transport as a Proportion of Mean High-Income Levels UGANDA ZIMBABWE Low Medium High Low Medium High • Relative Wealth • Income/Expenditure 7 28 100 29 57 100 • Daily Short-distance Trips • Total time travelling 102 109 100 119 114 100 • Total distance 54 97 100 54 60 100 • Average trip speed 46 86 100 52 58 100 • Proportion walking 295 211 100 595 116 100 • Proportion fare 92 116 100 129 156 100 • Paying transport • Annual Long-distance Travel • Total distance 44 54 100 17 34 100 • Household Transport Assets and Expenditure • Bicycle Possession 70 81 100 92 70 100 • Car Possession 0 22 100 22 65 100 • Proportion of HH • Expenditure on 63 84 100 68 86 100 transport Source: SLAM data, 2001
Policies to Promote ‘Efficient’ Mobility and Access • Ensuring access through planning • Sensitivity to income-differentiated mobility needs • Meeting locality-differentiated mobility needs • Traffic alleviation in the primate city • Preventing future traffic problems in secondary cities • Exploring peri-urban potentialities • Village visions