Generating Capacity Expansion and System Interconnections
410 likes | 568 Views
Generating Capacity Expansion and System Interconnections. GridSchool 2010 March 8-12, 2010 Richmond, Virginia Institute of Public Utilities Argonne National Laboratory Vladimir Koritarov Center for Energy, Economic, and Environmental Systems Analysis

Generating Capacity Expansion and System Interconnections
E N D
Presentation Transcript
Generating Capacity Expansion and System Interconnections GridSchool 2010 March 8-12, 2010 Richmond, Virginia Institute of Public Utilities Argonne National Laboratory Vladimir Koritarov Center for Energy, Economic, and Environmental Systems Analysis Decision and Information Sciences Division ARGONNE NATIONAL LABORATORY koritarov@anl.gov 630.252.6711 Do not cite or distribute without permission MICHIGAN STATE UNIVERSITY
Planning Should Lead to Specific Actions • The ANALYSIS provides information to decision-makers. • The PLAN is a statement of the choices made. • Planning is a continuous activity. Projects Decision- Making Information Analysis Data Collection Policies Further Study
1. DEFINE OBJECTIVES 2. DEFINE APPROACH 3. DETERMINE INFORMATION NEEDS 5. CONDUCT ANALYSIS 4. CHOOSE ANALYSIS PROCESS 6. PRESENT RESULTS 7. PREPARE PLAN There are 7 Key Steps in the Planning Process
IMPORTS COST 1 2 3 1 2 3 CASE CASE ENVIRONMENTAL EFFECTS 1 2 3 CASE An Important Part of the Planning Process is the Presentation of Results to Decision-Makers • The results should be presented in the form of decision-making information:
Integrated Resource Planning (IRP) Perspective for Long-Term System Expansion Is Important • IRP is a planning methodology that integrates both supply and demand-side options for developing the least-cost expansion strategy • IRP produces a long-term resource strategy by considering all available supply and demand-side options: • Generating technologies (conventional thermal and hydro power plants, renewable technologies, etc.) • Distributed energy resources (e.g., distributed generation) • Energy efficiency resources (e.g., conservation) • Demand-side management programs (e.g., shaping electricity demand) • Long-term power purchase contracts • The objective of IRP is to determine the least-cost resource strategy by evaluating the cost-effectiveness of all available resource options on a consistent, integrated basis
Strategic Resource Planning Primarily Deals with Medium and Long-Term Time Horizons PLANNING HORIZON Increasing Time Medium (5-10 years) Long (>10 years) Short (<5 years) Demand Primary Area of Interest CATEGORY OF ELECTRIC SYSTEM PLANNING Generation Transmission Distribution Implies Intercellular Ineractions to be Addressed
Load Dispatcher Distribution Transmission Peaking Cycling Generating System Base Fossil Hydroelectric Nuclear Strategic Planning 0 1 2 3 4 5 6 7 8 9 10 11 12 Years Various Types of Planning Require Different Time Horizons
Investment Decisions in Traditional vs. Deregulated Electricity Markets Generating system expansion analysis in regulated power systems must address a number of critical issues: • Long-term demand forecasts and changes of load profiles over time • Long lead times for the construction of new generating units • Reliability of power system operation (unit outages, hydro inflows, etc.) • Large variety of candidate technologies (e.g., plant types and unit sizes) • Economic uncertainties (fuel prices, investment costs, etc.) In deregulated power systems, the analysis must also consider: • Long-term projections of electricity prices in the market • Actions and investment decisions of competing generating companies, IPPs, and new market entrants
“Best” Plan Over Time Time Years The Traditional Resource Planning Method in Regulated Utilities Is to Find the Optimal Construction Plan for the Entire System One Generation Company Objective: Identify the generating system expansion plan that has the minimum net present value of all operating and investment costs during the study period State (Expansion Option)
Objectives for Constructing New Capacity in Restructured Markets Differ from those under Vertically Integrated Systems • Multiple competing market participants instead of single decision maker: • Each market player makes its own independent investment decisions • Players have only limited information about the competition • Ideally an individual player cannot control the market • Market participants face multiple uncertainties • Expansion investments are based on financial considerations, not lowest societal cost or energy security concerns: • Profits are often the main driving force behind the decision making process • Financial decision criteria are typically based on measures such as rate of return on investment, payback period, and risk indicators • Other factors such as market share may influence the decision making process • Capacity expansion by competitors and new market entrants are uncertain • Emphasis is on the risk and risk management for corporate survival versus guaranteed rate of return under the traditional regulatory structure
In an Open Market, An Individual GenCo Will Make Investment Decisions That it Perceives Are “Best for the Company” Open electricity market includes existing GenCos as well as new entrants! The Sum of Independent Investment Decisions May Be Very Different from the Least-Cost System Expansion Plan
Capacity Expansion Planning in Restructured Power Markets In restructured electricity markets there are multiple entities involved at different levels: • Policy Makers (Government/Ministry) • Energy Regulatory Agency • Market Operator(s) • Transmission System and Dispatch Operators • Load Serving Entities/Consumers: • Distribution companies • Retail market aggregators • Direct consumers (large industry, commercial, etc.) • Generation Companies • Individual Investors/IPPs All of these entities have an interest in system planning, but from different angles.
Electric System Resource Planning Is Linked to the Overall Energy Planning • Primary connection is through the demand forecast • Additional connections: • Resource utilization policies • Energy sector deregulation and restructuring policies • Environmental policies • Benefits of linkage: • Avoids duplication of effort (e.g., for demand forecasting) • Provides consistent assumptions for major independent variables, such as population growth • Develops good understanding of forecast assumptions Energy Demand Forecasting Electricity Demand Forecasting Generating System Expansion Planning T&D Planning
Electricity Demand Forecast Is One of the Most Important Parts of Analysis Electricity demand forecasting analysis should address: • Peak loads (MW) • Energy demand (GWh) • Seasonal load variations • Changes in demand shape (load profiles) over time • Errors in future estimated demand
Electricity Consumption Historical Projected Years There Are Numerous Techniques for Forecasting Electrical Loads and Energy Demand • Different techniques are used for short-term and for long-term time horizons • Short-term operation planning is more concerned with forecasting hourly loads • Weather plays a great role in short-term load forecasting models • Long-term expansion planning deals with the growth rates of electricity consumption and changes in peak loads from year to year • Population and economic growth are some of key drivers in the long term • Common demand forecasting approaches: • Time series analysis • Econometric models • End-use models
Four Basic Questions Must Be Answered in the Capacity Expansion Planning Process • WHAT capacities to install to ensure an appropriate level of reliability? • HOW to pick the best combination of different generating technologies available now and in the future? • WHERE to locate this new capacity? • WHEN is the proper time to incorporate new capacity additions into the system?
Various Technologies Are Currently Available as Candidates for Expansion • Steam fossil • Hydroelectric • Combustion turbines • Diesel engines • Combined cycle • Pumped storage • Nuclear • Wind • Solar • Biomass • Geothermal • Distributed and demand-side resources • Etc.
The Planner Must Also Consider Potential Future Options • Fuel cells • Photovoltaic • Ocean thermal energy conversion • Wave and tidal power • Storage technologies: • Batteries (including flow batteries) • Compressed air energy storage (CAES) • Flywheels • Superconducting magnetic energy storage (SMES) • Super-capacitors • Distributed storage (e.g., V2G technologies)
A Fundamental Aspect of Any Economic Evaluation Is the Time Element • The system expansion analysis is typically performed for a period of 20-30 years • Time value of money • Inflation (deflation) changes the buying power of money • Real changes over time (real escalation) due to factors such as resource depletion, increased demand, improvements in design and manufacturing, etc. • The annual factor that accounts for the time value of money independently of inflation is called the real discount rate (or real present worth rate) • Discount rate: • Necessary for comparing alternatives • Results are clearly sensitive to the choice of discount rate • Selected discount rate should be appropriate for electric utilities and may reflect: • Average cost of capital • Scarcity of capital • Opportunity cost of capital, etc.
The Primary Objective of an Electric Power System Is to Adequately Meet the Demand at Minimum Cost • Meaning of “adequately” • Costs of different reliability levels • Numerous factors are affecting system reliability • Random unit breakdowns • Demand variations • Hydroelectric variations • Scheduled maintenance • Nuclear refueling • Cancellations and delays in the construction of new capacity
The Reliability of Supply is an Important Issue in Electric Power Systems Expansion Planning • Utilities use a number of parameters to estimate expected reliability of supply: • Reserve margins • Loss-of-Load Probability (LOLP) • Loss-of-Load Expectation (LOLE) • Expected Unserved Energy (EUE), etc. • These are either used as constraints in the planning process or as targets for desired reliability levels • In the United States power systems are typically planned for 99.97% reliability. This corresponds to the LOLE of 1 day in 10 years (LOLP=0.0274%) • In developing countries, the power systems are typically planned for 99.7% reliability. This corresponds to the LOLE of 1 day per year (LOLP=0.274%)
A Development Philosophy Should Be Clearly Stated • Use of primary energy resources • Long-term fuel supply availability • Domestic vs. imported fuels • Fuel dependency • Energy efficiency • Environmental protection • Isolated vs. interconnected operations • Emergency supply • Interruptible exchange • Joint planning • Short-term purchases/sales • Joint ownership • Market orientation • Etc.
Once a Potential Generation Expansion Solution Is Found, Other Constraints Must Be Considered • Transmission planning and analysis • Unit size • Fuel supply • Manpower requirements and training • Financial • Environmental impacts • Infrastructure needs • Plant location (siting analysis) • Etc.
Schematic Representation of the Planning Process and Consideration of Constraints
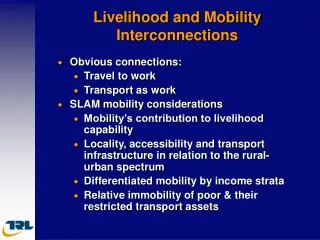
Regional Perspective in Resource Planning • Historically, electric utilities served a defined geographical service territory • Utilities were constructing new generating capacity almost exclusively on their service territory • With wider integration of utility systems into larger interconnections, it was possible to construct new capacity in other areas and transfer power via transmission lines (e.g., joint ownership) • Deregulation and restructuring of power sector allows consumers to choose their suppliers (e.g., green power suppliers) • Except for the distribution companies, the service territory boundaries are largely disappearing • Also, new market entrants can come into open markets (e.g., merchant power plants, load aggregators, etc.) • In competitive electricity markets, the investors are trying to construct new generating capacity in most profitable locations or areas
Electricity Markets in North America • The trend is toward establishing large electricity markets • Large interconnections in a competitive environment should provide positive pressure leading to: • Increased efficiency of system operation • Lower average market prices of electricity
Economic and Reliability Benefits of Large System Interconnections • Lower operating costs • Higher utilization of most economical units • Large pool of available generating units provides more flexibility in scheduling and dispatch • Demand diversity • Simultaneous peak load of several interconnected systems is usually lower than the sum of individual (non-coincidental) peak loads • Merit order investments into new projects • Most economical new projects are built first • Better utilization of renewable sources • Overcome uneven geographical distribution of renewable resources • Allow for higher penetration of renewable resources • Economy of scale and joint ownership • Some projects may be too big for individual systems • Lower total investment costs • Larger units have lower specific costs per kW • Lower total reserve margin requirements • Lower total contingency reserve requirement • Shared spinning reserve • Power exchanges and emergency supply
The Peak Load for Interconnected System is Usually Smaller than the Sum of Individual Peak Loads 7,400 MW 4,500 MW 3,300 MW Benefits: Build less capacity Build bigger units Individual peaks: 3300 + 4500 = 7800 MW Combined system peak: 7400MW
Reserve Sharing • Contingency reserve sharing agreements reduce operating costs • The system needs to maintain enough reserve to cover the largest single hazard • Typically, the system should be able to cover the demand even if an outage of the largest unit in operation should occur A. Independent operation B. Interconnected operation System B Largest Unit = 600 MW A System B Largest Unit = 600 MW System A Largest Unit = 600 MW System A Largest Unit = 600 MW CR=600 MW CR=300 MW CR=600 MW CR=300 MW Both systems maintain contingency reserve of 600 MW each Total contingency reserve required for both systems is 600 MW
Regional Transmission Planning for Better Utilization of Renewable Energy Resources JCSP’08: 20% Wind Scenario Wind Power
Case Study: Where to Locate the First Nuclear Plant in Poland? • The expansion analysis determined that nuclear power in Poland will be needed from 2017 • The locational analysis was performed using simplified zonal representation of the Polish power grid and interconnections with neighboring countries • 5 potential locations in zones/regions of Poland were considered • 1 potential location outside of Poland (in Lithuania) was also considered
Analysis Showed that Nuclear Plant Should Be Constructed in the Northern or Western Regions of Poland • In a completely deregulated market, locational marginal prices (LMPs) show the economic strain on the grid. The analysis examined the impacts on LMP electricity prices resulting from different zonal locations of new nuclear plant. • Average LMP price reduction for different locations of new nuclear plant:
A Nuclear Plant Located in the Northern or Western Regions Also Reduces Volatility of Electricity Prices Average monthly LMP price volatility index by zone for different locations of new nuclear plant:
A B A B C D C D E E F F Argonne’s Approach for Optimal Zonal Locations of New Capacity Additions in Interconnected Power Systems • Locationalanalysis can be applied to several interconnected systems or to a single system consisting of several zones. • Each system or zone may have a number of generating units, loads, or both. • Firm bilateral contracts or exchanges can also be taken into account when calculating available transfer capabilities.
Decision Parameters Are Calculated for Each System or Zone Status in 2007 (Base Year) RM = LOLP = ENS = MCP = Economic Resource Environmental RM = LOLP = ENS = MCP = Economic Resource Environmental A B RM = LOLP = ENS = MCP = Economic Resource Environmental RM = LOLP = ENS = MCP = Economic Resource Environmental C D RM = LOLP = ENS = MCP = Economic Resource Environmental RM = LOLP = ENS = MCP = Economic Resource Environmental F E
Decision Parameters Change over Time Updated parameters! Status in 2015 New generating units built between the base year and 2015! ~ ~ RM = LOLP = ENS = MCP = Economic Resource Environmental RM = LOLP = ENS = MCP = Economic Resource Environmental ~ A B Reinforcement of this line from 2009! RM = LOLP = ENS = MCP = Economic Resource Environmental ~ RM = LOLP = ENS = MCP = Economic Resource Environmental C D New line from 2012! RM = LOLP = ENS = MCP = Economic Resource Environmental RM = LOLP = ENS = MCP = Economic Resource Environmental Updated supply and demand curves! ~ ~ ~ ~ Updated environmental regulations! Updated social parameters! F E
The Approach Takes into Account Multiple Criteria for the Siting of New Capacity By varying the weight coefficients a, b, and c in the equation below, the user may put more or less importance on certain criteria that maximize the locational utility function (LUF): Case study: Max LUF[RM(x), RMi(x), ZP(x)] = f[a × RM(x), b × RMi(x), c × ZP(x)] subject to resource, social, and other constraints L = 2000 MW P = 2200 MW L = 1000 MW P = 1050 MW RM = 10% RMi = 27.5% ZP = 45$/MWh Resource Social, etc. RM = 5% RMi = 35% ZP = 50$/MWh Resource Social, etc B 100 A 100 300 200 200 300 L = 3000 MW P = 3300 MW RM = 10% RMi = 18.3% ZP = 30$/MWh Resource Social, etc. RM = Reserve margin RMi = Reserve margin with interties ZP = Isolated zonal price C
Resource, Social and Other SitingConstraints Are also Observed • Some resource, social, environmental, and other constraints may restrict the siting of certain generating technologies in some zones • A matrix of these exclusion constraints is provided to the model to take into account the zonal restrictions over the study period Example: 0 = siting not allowed in this year 1 = siting allowed
The Results of the Analysis Provide Information on Zonal Locations of New Capacity Additions • The results of siting analysis are summarized in a table: 0, 1, 2,.. = Number of units commissioned in this year
In Conclusion, Resource Planning Is a Very Complex Process • Coordination of system planning categories • Coordination with overall energy system planning and macroeconomic development • Numerous uncertainties: • Demand forecast • Technology performance • Fuel availability and cost • Financial conditions, etc. • Long time horizons • Enormous number of alternative long-term expansion pathways or scenarios • For each particular generating system configuration, system operation also must be optimized