Chapter 5 Human Geography Population & Culture
760 likes | 1.32k Views
Chapter 5 Human Geography Population & Culture. The Study of Human Geography. Demography – statistical study of human populations Population Density Population Distribution Natural Increase World Population Trends . Population Density.

Chapter 5 Human Geography Population & Culture
E N D
Presentation Transcript
The Study of HumanGeography • Demography – statistical study of human populations • Population Density • Population Distribution • Natural Increase • World Population Trends
Population Density • Avg # of people in an area, expressed as persons per sq. mi. or km. • Population Density varies worldwide * Canada = 8/mi * Bangladesh = 2,349/mi • Depends on size of country, size of population & environmental conditions
2. Population Distribution • People are spread out UNEVENLY over earth. Why? To live in areas favorable for settlement. * fertile soil * access to fresh water * mild climates • 90% live in northern hemisphere • 2/3 of those live in mid-latitudes (20 - 60N) • Many in fertile river valleys near edges of continents • Few people in polar climates, deserts, rugged mts.
Population Change • # of people depends on 3 major factors a. birthrate: # of births/yr for every 1000 living in a place b. deathrate: # of deaths /yr for every 1000 living in a place c. Migration: process of moving from one place to another - emigrants: people who leave (exit) a country to live in another - immigrants: people who come into a new country to live • Zero Population Growth: birthrate + I = Deathrate +E
4. Rate of Natural Increase • Birthrate – deathrate, implying the annual rate of population growth or decline w/o regard for migration (expressed as %) • Varies worldwide world: 1.2% US: 0.6% Russia: -0.6% Uganda: 3.1% • If country grows at 3%, it will double in 23 yrs!! (doubling time)
Birth and Death Rates, Worldwide Rates of birth, death, and natural increase per 1,000 population Natural Increase Source: United Nations, World Population Prospects: The 2004 Revision, 2005.
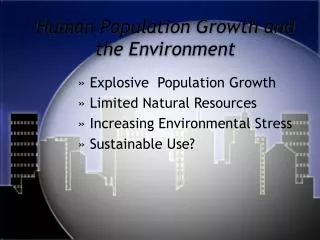
5. Population Growth • Population has grown rapidly in last 200 years. Why? a. improved farm technology b. improved public sanitation c. improved medical technology • Explosive growth in developing countries • Near zero population growth in many developed countries • Concern of overpopulation – when # of people too large to be supported by available resources
World Population Growth Through History Billions 12 11 2100 10 9 Modern Age Old 8 Iron Middle Bronze Stone Age New Stone Age Ages Age Age 7 Future 6 2000 5 4 1975 3 1950 2 1900 1 1800 Black Death — The Plague 2000 1+ million 7000 6000 5000 3000 1000 A.D. 4000 A.D. A.D. A.D. A.D. A.D. years B.C. B.C. B.C. B.C. B.C. B.C. B.C. 1 1000 2000 3000 4000 5000 Source: Population Reference Bureau; and United Nations, World Population Projections to 2100 (1998).
World Population Growth, in Billions Number of years to add each billion (year) All of Human History (1800) 130 (1930) 30 (1960) 15 (1975) 12 (1987) 12 (1999) 14 (2013) 14 (2027) 21 (2048) Sources: First and second billion: Population Reference Bureau. Third through ninth billion: United Nations, World Population Prospects: The 2004 Revision (medium scenario), 2005.
Growth in More, Less Developed Countries Billions Less Developed Regions More Developed Regions Source: United Nations, World Population Prospects: The 2004 Revision (medium scenario), 2005.
B. Population Pyramids 1. A PP is a model that shows population distribution by age and gender for a given period of time for a given country
What are the stages of PPM - each stage exhibits specific characteristics - interpreted through shape
Why use Population pyramids? a. graphically display a population's age and gender composition b. are bar graphs c. show numbers or proportions of males and females in each age group d. show gains of cohort members due to immigration and birth, and loss of cohort members due to emigration and death and e. reflect population growth or decline. Dynamic Population Pyramid for United States
Analysis of Stages A. Stage 1 Both high birth rates and death rates fluctuate in the first stage of the population model giving a small population growth (shown by the small total population graph). There are many reasons for this: • little access to birth control • many children die in infancy (high infant mortality) so parents tend to have more children to compensate in the hopes that more will live • children are needed to work on the land to grow food for the family • children are regarded as a sign of virility in some cultures • religious beliefs (e.g. Roman Catholics and Hindus) encourage large families • high death rates, especially among children because of disease, famine, poor diet, poor hygiene, little medical science.
B. Stage 2 Birth rates remain high, but death rates fall rapidly causing a high population growth (as shown by the total population graph). The reasons for this could be: • improvements in medical care - hospitals, medicines, etc. • improvements in sanitation and water supply • quality and quantity of food produced rises • transport and communications improve the movements of food and medical supplies • decrease in infant mortality.
C. Stage 3 Birth rates now fall rapidly while death rates continue to fall. The total population begins to peak and the population increase slows to a constant. The reasons for this could be: • increased access to contraception • lower infant mortality rate means there is less need to have a bigger family • industrialization and mechanization means fewer laborers are required • the desire for material possessions takes over the desire for large families as wealth increases • equality for women means that they are able to follow a career path rather than feeling obligated to have a family.
D. Stage 4 Both birth rates and death rates remain low, fluctuating with 'baby booms' and epidemics of illnesses and disease. This results in a steady population.
3. Developing vs Developed a. The developing countries have a population structure that resembles a pyramid with a broad base of young and a small apex of old.
b. The developed countries are beginning to lose their "pyramidal" shape as they become more straight up and down with almost equal numbers of people in adjacent age groups until the ages of high death rates begin after age 65.
c. Very Developed Nation: a population pyramid for an even older and less pyramidal developed country.
d. The United States View the United States population pyramids for 1900, 1960, 1980, 2000, 2010, and 2030. Over time, the pyramid changes from a "pyramid" to a sky scraper or an "empire state building" shape . This is the kind of change that all societies like the U.S. have experienced. Notice how the bulge of the baby boomers impacts successive U.S. pyramids. Imagine the problems connected with providing schools for this group of people in 1960, jobs in 1980, and houses in 1990. These are the people who will be eligible for Social Security between 2010 and 2030. By 2030, many of them will have died out as the earlier baby boomers will be over 85 than, and the population--barring any unexpected changes--will have age groups of roughly similar size up to older ages. At the older ages, the pyramids indicate not only the decreasing numbers of people but also the preponderance of females that occurs at the oldest ages. This "feminizing" of the population as it gets older is due to sex differences in mortality. dynamic population change - USA
4. Why does it matter? a. people of different ages have different needs, abilities, responsibilities, and entitlements b. the importance of age differences arise because of the societal expectations and societal circumstances that determine what one does at a given age and what one is entitled to at a given age. • Dependency ages (under 18 – over 65?)
C. Demographic Transition Model 1. A DTM is a model that explains the population history of a country or region – shows how population changes as a country develops
What are the stages of DTM - each stage exhibits specific characteristics - Stages A- E show what characteristics you can expect for each stage and possible reasons for changes btwn stages Population change is shown in two ways here • change over SPACE: a number of countries at the same time can exhibit the population characteristics of different stages. 2. Second is change over TIME: a country will theoretically progress through the stages. It has been a long time since this model was developed, and some countries have begun to exhibit characteristics beyond stage 4.
Characteristics: High birthrates & high death rates Effect of population growth: Little change in population • Analysis of Stages A. Stage 1 Both high birth rates and death rates fluctuate in the first stage of the population model giving a small population growth (shown by the small total population graph). There are many reasons for this: • little access to birth control • many children die in infancy (high infant mortality) so parents tend to have more children to compensate in the hopes that more will live • children are needed to work on the land to grow food for the family • children are regarded as a sign of virility in some cultures • religious beliefs (e.g. Roman Catholics and Hindus) encourage large families • high death rates, especially among children because of disease, famine, poor diet, poor hygiene, little medical science.
B. Stage 2 Birth rates remain high, but death rates fall rapidly causing a high population growth (as shown by the total population graph). The reasons for this could be: • improvements in medical care - hospitals, medicines, etc. • improvements in sanitation and water supply • quality and quantity of food produced rises • transport and communications improve the movements of food and medical supplies • decrease in infant mortality. Characteristics: High birthrates & declining death rates Effect of population growth: Life expectancy increases significantly and population grows explosively
Characteristics: Birthrates decline and low death rates Effect of population growth:Population growth slows C. Stage 3 Birth rates now fall rapidly while death rates continue to fall. The total population begins to peak and the population increase slows to a constant. The reasons for this could be: • increased access to contraception • lower infant mortality rate means there is less need to have a bigger family • industrialization and mechanization means fewer laborers are required • the desire for material possessions takes over the desire for large families as wealth increases • equality for women means that they are able to follow a career path rather than feeling obligated to have a family.
Characteristics: Very low birth and death rates Effect of population growth: Little population growth D. Stage 4 Both birth rates and death rates remain low, fluctuating with 'baby booms' and epidemics of illnesses and disease. This results in a steady population.
Characteristics: deathrate higher than birthrate Effect of population growth: population decline E. Stage 5?? A stage 5 was not originally thought of as part of the DTM, but some northern countries are now reaching the stage where total population is declining where birth rates have dropped below death rates. One such country is Germany which has taken in foreign workers to fill jobs. Other countries with declining populations include: Japan, Russia, and much of Eastern Europe
Case Study of Population Change Over Time - DTM and Pyramids for UK (1780 - present)
Push Factors: What factors cause a person/s to leave the country they’re in Pull Factors: What factors attract a person/s to go into another country
II. Cultural Geography A. Culture is 1. all features of a people’s way of life 2. learned and passed down from parents to children through teaching, example & imitation 3. includes language, religion, architecture, clothing, economics, family life, food, gov’t, roles of women/men etc.
B. Cultural Hearth 1. A place where important ideas begin and from which they spread to surrounding cultures 2. SW Asia: domestication of animals, crops, writing & math 3. China: language, arts, technology
C. Cultural traits 1. Some the same around the world: reading, math, alphabets, 2. Some different: knife & fork vs chopsticks 3. Some traits linked, such as religion, farming, use of technology - example: The Amish in America
governmentExample: democratic system, elected officials at local, state, and national levels religion education economy language food Culture Traits housing clothing Cultural Traits Cultural Geography
D. Cultural Regions 1. An area in which people have many shared culture traits 2. Some countries have one dominant culture (Japan), others may have many (Kenya, South Africa) 3. Country borders sometimes divide culture regions and separate one ethnic group (Kurds) 4. Can be made up of several countries with same language, traditions, systems of gov’t(Australia & New Zealand)
E. Cultural Landscapes 1. Humans alter landscape in their use of natural resources 2. Ag. landscape in US very diff. than China 3. Many urban landscapes worldwide are similar