Download
1 / 46
460 likes | 479 Views
Learn to identify and plot variables such as independent and dependent variables, set up proper axis labels with units, scale graphs effectively, draw best-fit lines, and interpret data accurately.

E N D
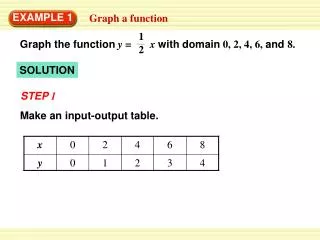
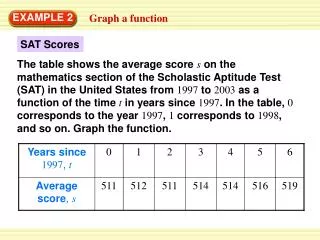
Making a Scientific Graph The Basics.
Identifying Variables Independent Variable (manipulated variable) the thing the scientist is changing gets plotted along the x axis A control group is usually tested which gets none of the independent variable Dependent Variable (responding variable) the thing responding to the change gets plotted on the y axis Example: Adding Miracle*Gro to help tomato plants grow
Independent & Dependent Variables Your Turn Joe wants to see if adding sugar to water will affect the density of the water. He designs an experiment where he measures the density of pure water, then dissolves 5 grams of sugar in and measures the density again. Next, 5 more grams of sugar are added and the density is determined yet again. This is repeated until no more sugar dissolves. Identify the independent and dependent variable in Joe’s experiment.
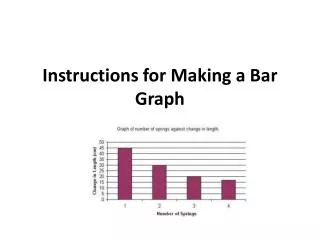
Components of a Graph Axis Labels Each variable should be clearly labeled with the type of measurement (Mass, Volume, Length, etc) The units used are put in parenthesis
Components of a Graph Title Minimum title: Y vs X Examples mass vs volume Must always include both variables Better titles are a little more descriptive The effect of (ind variable) on (dep variable) of (object) Examples The effect of percentage sugar on density of water The effect of Mass of Miracle*Gro on the height of tomato plants “Effect” is the noun, “Affect” is the verb
Units are in parenthesis after label Dependent Variable is on Y axis Independent Variable is on X axis Title has both variables in it. Components of a Graph Axis Labels Show example graphs here
Capitals should be used 1 Title only includes one variable Should be “affected” Can you find the 6 errors in this graph set-up? 2 3 No units are given in parenthesis 4 Axis Labels Show example graphs here 5 Variables on wrong axis Does not describe what was measured 6
Your Turn • Use your graph paper to include a proper title and axis labels for this experiment.
Components of a Graph Scale In a Scientific Graph, the scale is zoomed in so that the graph “fills the paper” to set scale, look at the range of your data for each variable Put lowest value near bottom edge of graph and highest value near top This span should cover at least 75% of graph Scale does not have to start at 0,0 Try to make every block equal to a “nice” number 1,2,4,5 or any division of 10 of these (0.2, .05, 400. etc) Stay away from ‘ugly’ scales Every block = 3,7,9, etc
Identifying Variables - Example Let’s say we were making a graph of the relationship the between the temperature and the volume of a balloon. If we did this by changing the temperature and recording what the consequent volume was, then the __________ would be the independent variable, and the ___________ would be the dependent variable.
What axis does the independent variable go on? What is the dependent variable? How do we show the units? What would be a good title? Notice how it fills the window & does not start at zero
Example of Poor X Axis Scale: Empty Space !!!!!
Example of Poor Y Axis Scale: Empty Space !!!!!
Example of Poor Y Axis Scale: Fills up less than half of window
Your Turn: Set an appropriate scale for the data below and plot the points on your graph paper Fill out scale legend at top of graph paper
Best-Fit Line • Once points are plotted, draw the straight line that comes closest to hitting all points.
Best-Fit Line • Notice that about half the points are above line and half are below. The line represents the ‘middle’ of all of the points. Above Line Below Line
Your Turn • Draw the best-fit line on your Miracle Gro Graph • Rulers are in the side drawers
Interpolating Data Use the graph to predict what is the volume of the balloon at 27 deg C ? Volume = 1.91 L
Interpolating Data At what temperature is the balloon 2.5 liters ? Temp = 38.0 °C
Interpolating Data What would the volume of the balloon be at 80 C ? Temp = 38.0 °C
Extrapolating Data What is the volume of the balloon when it is 80 °C? Volume = 4.8 L Can you think of a way to solve this without using graph? Interpolating Range
Extrapolating Data What is the volume of the balloon when it is 80 °C? Volume = 4.8 L Predicted value is outside of range of tested values Interpolating Range
Make up a question requiring extrapolation How confident would you feel in making this prediction?
Explain the difference between interpolating and extrapolating from your data. Compare the reliability of the two.
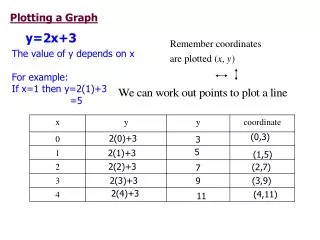
How do you find the slope of a line? • Slope is the rise over the run. Slope = ΔY ΔX Slope = Y2 – Y1 X2 – X1
These two points are NOT on your line Determining the Slope of a Best-Fit Line • Pick any two points that are on your best-fit line • Pick points that are fairly far apart They will give you the slope of a different line instead of your best-fit line
(36.8, 2.50) (20.0, 1.50) Determining the Slope of a Best-Fit Line • Write the coordinates for those 2 points on your graph • Use the coordinates to calculate the slope of best-fit line Slope = Y2 – Y1 X2 – X1 Slope = 2.50L – 1.50L 36.8 C – 20.0 C Slope = 0.0595 L/°C
Your Turn: Determine the Slope of the Line General formula for any straight line • How does this slope compare with yours? • Same Answer? • Sig Figs? • Units?
Your Turn: Determine the Slope of the Line m = slope b = Y-intercept: Value of Y when x = 0 More on Y-intercept Equation can be made more specific: Y = m x + b = ( ) + 11.8cm 1.02 cm/g Height Mass
Which equation represents the following graph correctly? A. volume = -3g/mL (mass) + 6 B. mass = 2g/mL (volume) -3 Volume (mL) C. -3 = 6g/mL (volume) + mass D. volume = 2g/mL (mass) + 6 E. mass = 2g/mL (volume) + -3 Mass (g)
Which equation represents the following graph correctly? Volume is Dependent Variable ( on Y axis) Volume (mL) D. volume = 2g/mL (mass) + 6 Mass is Independent Variable ( on X axis) y = m (x) + b Mass (g)
Sketch a graph represented by Speed = -5mps/m (Height) + 25 Y intercept = 25 Slope = -5 mps/m Speed is Dependent Variable ( on Y axis) Height is Independent Variable ( on X axis)
Sketch a graph represented by Speed = -5mps/m (Height) + 25 What will the speed be when the height is 3 m? Can Interpolate or plug values into equation
Warm-Up: Write a specific equation for the line below (1.0,20.0) (2.0,15.0) Speed (m/s) (3.0,10.0) (4.0,5.0)
Sketch a graph represented by Speed = -5mps/m (Height) + 25 Y intercept = 25 Slope = -5 mps/m Speed is Dependent Variable ( on Y axis) Height is Independent Variable ( on X axis)
Y- Intercept What is the Y-Intercept of this graph ? Y intercept = 2
Y- Intercept What is the Y-Intercept of this graph ? Y intercept = 11.8 cm
What is the Y- Intercept? Why isn’t this the Y-Intercept?
What is the Y- Intercept? Back Y-Intercept = 0