Understanding and Creating Bar Graphs: A Comprehensive Guide
A bar graph is a diagram that represents data with rectangular bars, where the horizontal axis shows the manipulated variable and the vertical axis depicts the responding variable. This guide teaches how to prepare a bar graph using scientific data, demonstrating through examples like student absences across grades and gender distribution in science classes. Key steps include drawing and labeling axes, plotting data, and filling in bars. Additionally, tips on maintaining consistency and clarity in design are provided for effective representation of data.

Understanding and Creating Bar Graphs: A Comprehensive Guide
E N D
Presentation Transcript
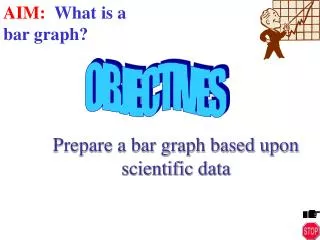
AIM: What is a bar graph? OBJECTIVES Prepare a bar graph based upon scientific data
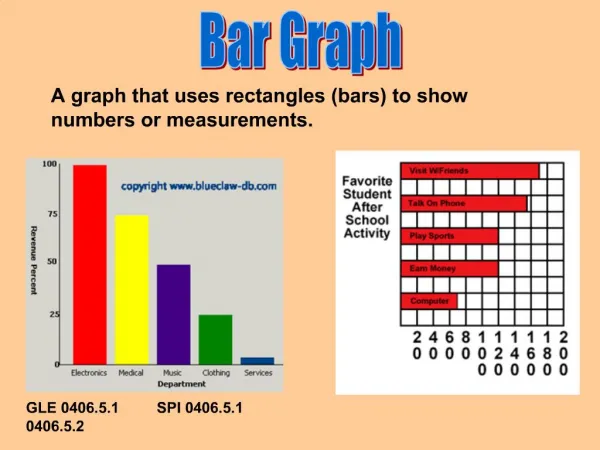
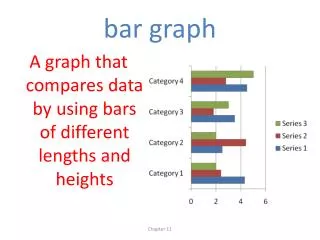
DEFINITION: • a BAR GRAPH is a diagram in which separate but related items are represented by rectangular shapes called “bars” • the horizontal axis usually represents the manipulated variable • the vertical axis usually represents the responding variable AIM: What is a bar graph?
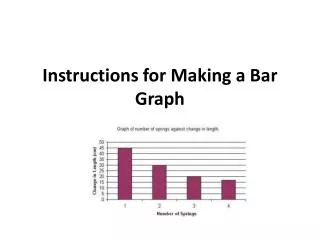
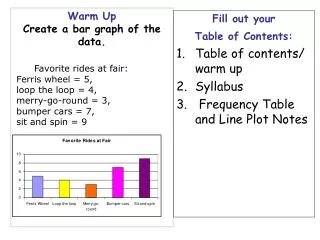
EXAMPLE: • Absences today • 6th grade 7 • 7th grade 12 • 8th grade 4 • Put this in a bar graph AIM: What is a bar graph?
Step One: Draw your axis: AIM: What is a bar graph?
Step Two: label your axis: 15 AIM: What is a bar graph? 10 # of Absences 5 6th 7th 8th Grade Level
Step Three: plot your data: 15 AIM: What is a bar graph? 10 # of Absences 5 6th 7th 8th Grade Level
Step Four: Fill in your bars: 15 AIM: What is a bar graph? 10 # of Absences 5 6th 7th 8th Grade Level
Step Five: What is Missing? TITLE YOUR GRAPH! 15 AIM: What is a bar graph? 10 # of Absences 5 6th 7th 8th Grade Level
Step Five: Possible Title -- Absences in Each Grade Level 15 AIM: What is a bar graph? 10 # of Absences 5 6th 7th 8th Grade Level
Step Five: Alternative Title {x vs. y} Grade Level vs. Absences 15 AIM: What is a bar graph? 10 # of Absences 5 6th 7th 8th Grade Level
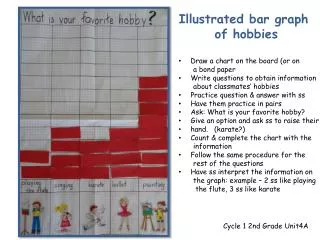
Example: What is the difference between boys and girls on Team A in each Science Class? 2nd period: 10B 8G 5th 8B 10G 6th 7G 11B 7th 12G 8B AIM: What is a Bar Graph?
What should we do first? We should probably put our “raw data” into a better and simpler data table. 2nd period: 10B 8G 5th 8B 10G 6th 7G 11B 7th 12G 8B any suggestions? AIM: What is a Bar Graph?
AIM: What is a Bar Graph? Boys and Girls in each Science Class Period Boys Girls 2 10 8 5 8 10 6 11 7 7 8 12
Step One: Draw your axis: AIM: What is a bar graph?
Step Two: label your axis: 15 AIM: What is a bar graph? # of Boys/Girls 10 5 2 5 6 7 Science Classes
Step Three and Step Four: Plot your data and fill in your bars: 15 AIM: What is a bar graph? # of Boys/Girls 10 5 2 5 6 7 Science Classes: Boys Girls
Step Five: ???? TITLE: Boys and Girls in Each Science Class 15 AIM: What is a bar graph? # of Boys/Girls 10 5 2 5 6 7 Science Classes
Step Five: ???? {x vs. y} Science Class vs. the Number of Boys and Girls 15 AIM: What is a bar graph? # of Boys/Girls 10 5 2 5 6 7 Science Classes
Tips for Bar Graphs? • The manipulated variable always goes on the x axis. (What does that mean?) • Title and Label all axis. Include the units! • Determine the correct “scale” to be used on the graph. • Make sure your vertical axis uses a scale which is consistent and does not change AIM: What is a bar graph?
Tips for Bar Graphs? • The width of all bars should be the same • You should leave a “skipped” space between each separate bar group. • That “skipped” space should be the same distance for each category AIM: What is a bar graph?
Tips for Bar Graphs? TITLE YOUR GRAPH AIM: What is a bar graph? Don't forget!
Table of Plant Days vs. Plant Height: Mark a Bar Graph: F-Plant 1 NF-Plant 2 (inches) (inches) 2 2 4 4 8 7 10 8 14 9 Day of Growth 2 5 10 15 20
: 14 12 10 Height of Plant 8 6 4 2 2 5 10 15 20 Days of Growth F-Plant 1 NF- Plant 2
What is wrong with this Graph (2 things) ? : 14 12 10 Height of Plant 8 6 4 2 2 5 10 15 20 Days of Growth F-Plant 1 NF- Plant 2
Days of Growth vs. Plant Height : 14 12 10 Height of Plant 8 6 4 2 2 5 10 15 20 inches Days of Growth F-Plant 1 NF- Plant 2
AIM: What is a Bar Graph? Class ACTIVITY: Creating Bar Graphs page 63
AIM: What is a bar graph? Homework: INTERNET QUESTIONS