Download

1 / 11
140 likes | 457 Views
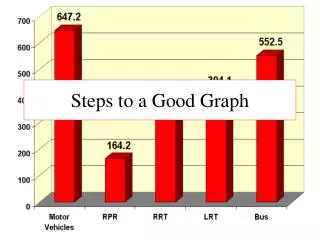
7 Steps to making a line graph. How to construct a line graph Click the left mouse Button to advance the notes. 7 steps to making a line graph. Identify the variables Determine the range Determine the scale Number and label each axis Plot the data points Draw the Trend line

E N D
7 Steps to making a line graph How to construct a line graph Click the left mouse Button to advance the notes
7 steps to making a line graph • Identify the variables • Determine the range • Determine the scale • Number and label each axis • Plot the data points • Draw the Trend line • Title the graph
(1) Identify the variables • Dependent variable • Always found on the right of a data table • Goes on the Y axis (DRY) Independent variable • Always found on the Left of a Data Table • Goes on the X axis (MIX) Sample Data table
(2) Determine the range Sample Data table • What values must be on this graph? • Subtract the lowest data value from the highest data value. (Each Variable) • This must be done for each Variable • Independent7-0= 7 • Seven numbers must fit evenly across the bottom of the graph • Dependent 600-0=600 • Six hundred numbers must fit evenly up the side of the graph
(3) Determine the scale • The numerical value for each square. • What scale should be used so that all your values fit on the graph? • The scale can be different for each axis • Must fill at least 75% of the graph paper • Try the basicsCount by 2,5,10, etc. • The graph to the side has seven blocks across its Y axis, we need 600 numbers to fit, therefore each block should count as one hundred numbers. • The graph to the side has eight blocks across its X axis, we need 7, therefore each block should count as one number
(4) Number and Label Both Axis • After writing in the numbers on both axis write descriptive labels for each axis • Include • Name of variables (From data Table) • Measurement type from the Metric System(Units, if included on Data table)
(5) Plot the data points • Putting your data on the graph, from the data table • Your first data point is (0,0) • Your second point is (1,6) count over 1 space and up to where the 6 would be. Place a dot there. • Your third point is (2,12) Count over 2 and up 12 and place a dot there. • Continue though the data table
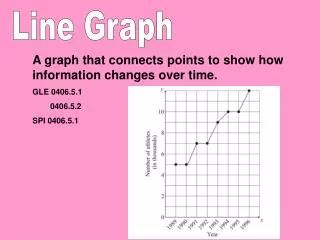
(6) Draw the trend line • DO NOT CONNECT THE DOTS!! • Draw a line which best fits the patterns you created (Best fit line) • This does not have to HIT every DOT!!! • Can be a curve or a straight line, It shows the pattern!
(7) Title the graph • Use a descriptive title or the formula below • Dependent VS. Independent Number of Colonies V.S. Number of Days This graph is complete !!
7 steps to making a line graph • Identify the variables • Determine the range • Determine the scale • Number and label each axis • Plot the data points • Draw the trend line • Title the graph
Finding the correct spacing • Divide the scale by the range. If >1 • Round up to the nearest whole number, every line will equal that value If <1 • Divide the range by the scale, round down to the nearest whole # and every line equals that value