Download

1 / 33
330 likes | 447 Views
This presentation outlines the process of creating high-quality graphs in SAS for publication, utilizing the Pacificare 30-day readmission measure as a case study. Key steps include visually examining the model's performance and preparing the graph for journal submission. Specific focus is given to the logit model, the correlation between predicted and observed readmission rates, and enhancing graph features like axes, legends, and overall layout to meet publication standards.

E N D
Making a Publication-quality Graph in SAS Bill O’Brien COLMR Analysis Guild Presentation February 15, 2013
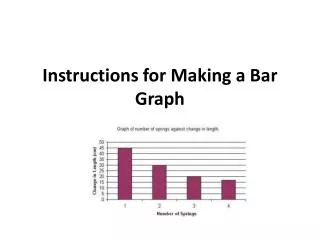
Outline for presentation • A quick look at the Pacificare 30 day readmission measure. • Visually examine one aspect of the performance of the model. • Show the steps to make the graph ready for journal submission.
Pacificare Readmissions Measure • Endorsed by NQF • Logit(Pi) = а + b * RWi+ ei • Pi -> binary variable indicating if index admission i resulted in readmission (1) or no readmission (0) • RWi -> DRG weight for claim i
Is DRG weight predictive of readmission? DRG RateType Rate 90 Actual 2.13% 90 Predicted 13.70% 605 Actual 13.97% 605 Predicted 13.70% 641 Actual 13.82% 641 Predicted 13.70% 688 Actual 17.45% • Predicted 13.70% [...] Model predicts anyone with DRG 605 has a 13.97% probability of readmission Patients with DRG 605 were readmitted 13.70% of the time.
Illustrating correlation between predicted and actual outcome
Default graph ods rtf; proc gplot data=analysis.graph1t; plot rate*DRG_order=RateType; run;quit; ods rtf close;
This graph needs work • Size of chart area • Title • Axes scale, labels, units • Plot symbols • Legend • Horizontal lines • Font • Borders
Size of chart area goptions device=gif hsize=7 vsize=4; ods rtf; proc gplot data=analysis.graph1t; plot rate*DRG_order=RateType; run;quit; ods rtf close;
Title goptions device=gif hsize=7 vsize=4; ods rtf; title h=1 'Figure 1. Predicted and observed readmission rates for 718 DRGs in VA Hospitals, FY08'; footnote ; proc gplot data=analysis.graph1t; plot rate*DRG_order=RateType; run;quit; ods rtf close;
Axes goptions device=gif hsize=7 vsize=4; ods rtf; title h=1 'Figure 1. Predicted and observed readmission rates for 718 DRGs in VA Hospitals, FY08'; footnote ; axis1 label=(a=90 'Readmission Rate'); axis2 order=1 to 718 by 1 label=('DRGs in Order of Predicted Rate') value=none major=none; proc gplot data=analysis.graph1t; plot rate*DRG_order=RateType /vaxis=axis1 haxis=axis2; format rate percent7.0; run;quit; ods rtf close;
Symbols goptions device=gif hsize=7 vsize=4; ods rtf; title h=1 'Figure 1. Predicted and observed readmission rates for 718 DRGs in VA Hospitals, FY08'; footnote ; axis1 label=(a=90 'Readmission Rate'); axis2 order=1 to 718 by 1 label=('DRGs in Order of Predicted Rate') value=none major=none; symbol1 color=green width=1 value=x height=1; symbol2 color=blue width=1 value=dot height=1; proc gplot data=analysis.graph1t; plot rate*DRG_order=RateType /vaxis=axis1 haxis=axis2; format rate percent7.0; run;quit; ods rtf close;
Legend legend1 label=('') value=('Observed Rate' 'Predicted Rate') position=(top left inside) across=1 down=2 cborder=black; proc gplot data=analysis.graph1t; plot rate*DRG_order=RateType /vaxis=axis1 haxis=axis2 legend=legend1; format rate percent7.0; run;quit;
Legend (alternative) legend1 label=('') value=('Observed Rate' 'Predicted Rate') position=(bottom center outside) across=2 down=1; proc gplot data=analysis.graph1t; plot rate*DRG_order=RateType /vaxis=axis1 haxis=axis2 legend=legend1; format rate percent7.0; run;quit;
Horizontal lines proc gplot data=analysis.graph1t; plot rate*DRG_order=RateType /vaxis=axis1 haxis=axis2 legend=legend1 vref=(.1,.2,.3,.4,.5,.6); format rate percent7.0; run;quit;
Horizontal lines (understated) proc gplot data=analysis.graph1t; plot rate*DRG_order=RateType /vaxis=axis1 haxis=axis2 legend=legend1 vref=(.1,.2,.3,.4,.5,.6) cvref=ligr; format rate percent7.0; run;quit;
Font goptions device=gif hsize=7 vsize=4 ftext=simplex;
Borders goptions device=gif hsize=7 vsize=4 ftext=arial border; [...] proc gplot data=analysis.graph1t; plot rate*DRG_order=RateType /vaxis=axis1 haxis=axis2 legend=legend1 vref=(.1,.2,.3,.4,.5,.6) cvref=ligr noframe ; format rate percent7.0; run;quit;
Does it work in grayscale? symbol1 color=dagr width=1 value=x height=1; symbol2 color=black width=1 value=dot height=1;
Journal screenshot Am J Med Qual. 2012 Jul-Aug;27(4):341-4. doi: 10.1177/1062860611428091. Epub 2012 Feb 9. Inappropriate use of payment weights to risk adjust readmission rates. Fuller RL, Goldfield NI, Averill RF, Hughes JS.
SAS code for reference goptions device=gif hsize=7 vsize=4 ftext=duplex border; ods rtf; title h=1 bold 'Figure 1. Predicted and observed readmission rates for 718 DRGs in VA Hospitals, FY08'; footnote ; axis1 label=(a=90 'Readmission Rate') ; axis2 order=1 to 718 by 1 label=('DRGs in Order of Predicted Rate') value=none major=none; symbol1 color=dagr width=1 value=x height=1; symbol2 color=black width=1 value=dot height=1; legend1 label=('') value=('Observed Rate' 'Predicted Rate') position=(bottom center outside) across=2 down=1; proc gplot data=analysis.graph1t; plot rate*DRG_order=RateType /vaxis=axis1 haxis=axis2 legend=legend1 vref=(.1,.2,.3,.4,.5,.6,.7) cvref=ligr noframe ; format rate percent7.0; run;quit; ods rtf close;