Investigating Motion with Graphs in The Energy Car Experiment
300 likes | 405 Views
Explore motion through creating a graph to predict time and distance relationship of a rolling car. Analyze data to test and refine predictions using a model created from the graph.

Investigating Motion with Graphs in The Energy Car Experiment
E N D
Presentation Transcript
Key Question • Why are graphs useful?
Making predictions from a graph • In science, a model is a relationship between variables. • For example, the car takes a certain amount of time to roll a certain distance down the track. • A model for the car’s motion would allow you to predict how long it would take the car to reach any distance down the track.
Making predictions from a graph • Graphs are a good way to visualize a model that involves two variables, such as time and distance. • In this Investigation you will create a model (graph) that predicts how long it takes the car to reach anywhere on the track.
Setting up • Set up the track with a long straight section. Your teacher will tell you which hole in the stand to attach the track. Each group will have a different angle.
Setting up • Put a clay ball on the stop at the bottom.
Setting up • Put the other stop at the top to provide a repeatable starting point for the car.
Setting up • Place photogate A on the mark shown in the diagram.
Setting up • Place photogate A on the mark shown in the diagram.
Setting up • Adjust the screw so the car breaks the light beam just after you release it. • Once you start the experiment, do not change the adjustment of the screw.
Setting up • The marks on the track are 5 cm apart.
Setting up • The marks on the track are 5 cm apart. • Place photogate B two marks (10 cm) lower than photogate A. • Roll the car and record the time from A to B.
Setting up • Move photogate B to 20, 30, 50 and 60 cm from photogate A. • Measure and record the time from A to B for each position • You will not be able to measure at 40 cm because of the split in the track. DO NOT measure at 70 cm (yet).
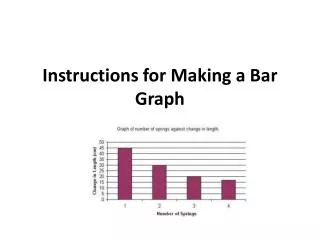
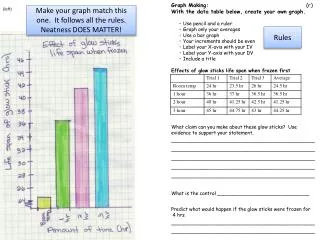
Analyze the data • Draw a graph showing the time from A to B on the y-axis and the distance from A to B on the x-axis. • This graph is a model that shows how the time and distance are related.
Analyze the data Use the graph to predict the time it should take the car to go 80 centimeters.
Analyze the data Use the graph to predict the time it should take the car to go 80 centimeters.
Analyze the data Use the graph to predict the time it should take the car to go 80 centimeters.
Test the model • Move photogate B so it is 80 cm away from photogate A.
Test the model • Move photogate B so it is 80 cm away from photogate A. • Test your prediction by rolling the car and measuring the time from A to B. • Do three trials with the same distance.
Test the model • Move photogate B so it is 80 cm away from photogate A. • Test your prediction by rolling the car and measuring the time from A to B. • Do three trials with the same distance.
Test the model • Move photogate B so it is 80 cm away from photogate A. • Test your prediction by rolling the car and measuring the time from A to B. • Do three trials with the same distance.
Test the model • Move photogate B so it is 80 cm away from photogate A. • Test your prediction by rolling the car and measuring the time from A to B. • Do three trials with the same distance. • Use the table below to record your data and calculate the error between the predicted and measured times.
Test the model • Move photogate B so it is 80 cm away from photogate A. • Test your prediction by rolling the car and measuring the time from A to B. • Do three trials with the same distance. • Use the table below to record your data and calculate the error between the predicted and measured times.
Stop and think a. How large was the difference between the prediction and the measurement? Was the difference significant (larger than the errors in the measurement)? The difference was .6%. The difference was not significant.
Stop and think b. Give at least one good reason why the prediction and measurement might not be in perfect agreement. Friction may be slowing the car down a small amount. Reading the lines off the graph is an estimation. The photogates placement could have been off slightly. The release technique could have varied slightly.
Stop and think c. Why was the time placed on the y-axis of the graph? The time was placed on the y-axis because it was the dependent variable.
Stop and think d. Give at least one way the prediction at 80 could be improved (short of doing the actual measurement). Use a very large graph to get a more exact prediction. Use a spreadsheet program on a computer to make a graph and prediction.