Chapter 9. Comparing Two Population Means
Chapter 9. Comparing Two Population Means. 9.1 Introduction 9.2 Analysis of Paired Samples 9.3 Analysis of Independent Samples 9.4 Summary. 9.1 Introduction 9.1.1 Two Sample Problems(1/7). A set of data observations x 1 ,… , x n from a population A


Chapter 9. Comparing Two Population Means
E N D
Presentation Transcript
Chapter 9. Comparing Two Population Means 9.1 Introduction 9.2 Analysis of Paired Samples 9.3 Analysis of Independent Samples 9.4 Summary
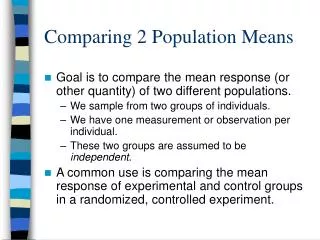
9.1 Introduction9.1.1 Two Sample Problems(1/7) • A set of data observations x1,… , xn from a population A with a cumulative dist. FA(x), a set of data observations y1,… , ym from another population B with a cumulative dist. FB(x). • How to compare the means of the two populations, and ? (Fig.9.1) • What if the variances are not the same between the two populations ? (Fig.9.2)
9.1.1 Two Sample Problems (2/7) Fig.9.1 Comparison of the means of two prob. dists. Fig.9.2 Comparison of the variance of two prob. dists.
9.1.1 Two Sample Problems (3/7) • Example 51. Acrophobia Treatments - In an experiment to investigate whether the new treatment is effective or not, a group of 30 patients suffering from acrophobia are randomly assigned to one of the two treatment methods. - 15 patients undergo the standard treat- ment, say A, and 15 patients undergo the proposed new treatment B. Fig.9.3 Treating acrophobia.
9.1.1 Two Sample Problems (4/7) - observations x1,… , x15 ~ A (standard treatment), observations y1,… , y15 ~ B (new treatment). - For this example, a comparison of the population means and , provides an indication of whether the new treatment is any better or any worse than the standard treatment.
9.1.1 Two Sample Problems (5/7) - It is good experimental practice to randomize the allocation of subjects or experimental objects between standard treatment and the new treatment, as shown in Figure 9.4. - Randomization helps to eliminate any bias that may otherwise arise if certain kinds of subject are “favored” and given a particular treatment. • Some more words: placebo, blind experiment, double-blind experiment Fig.9.4 Randomization of experimental subjects between two treatment
9.1.1 Two Sample Problems (6/7) • Example 45. Fabric Water Absorption Properties - If the rollers rotate at 24 revolutions per minute, how does changing the pressure from 10 pounds per square inch (type A) to 20 pounds per square inch (type B) influence the water pickup of the fabric? - data observations xi of the fabric water pickup with type A pressure and observations yi with type B pressure. - A comparison of the population means and shows how the average fabric water pickup is influenced by the change in pressure.
9.1.1 Two Sample Problems (7/7) • Consider testing • What if a confidence interval of contains zero ? • Small p-values indicate that the null hypothesis is not a plausible statement, and there is sufficient evidence that the two population means are different. • How to find the p-value ? Just in the same way as for one-sample problems
9.1.2 Paired Samples Versus Independent Samples (1/2) • Example 55. Heart Rate Reduction - A new drug for inducing a temporary reduction in a patient’s heart rate is to be compared with a standard drug. - Since the drug efficacy is expected to depend heavily on the particular patient involved, a paired experiment is run whereby each of 40 patients is administered one drug on one day and the other drug on the following day. - blocking: it is important to block out unwanted sources of variation that otherwise might cloud the comparisons of real interest (Analysis of Variance: ANOVA)
9.1.2 Paired Samples Versus Independent Samples (2/2) • Data from paired samples are of the form (x1, y1), (x2, y2), …, (xn, yn) which arise from each of n experimental subjects being subjected to both “treatments” • The comparison between the two treatments is then based upon the pairwise differences zi = xi – yi , 1 ≤ i ≤ n Fig.9.10 Paired and independent samples
9.2 Analysis of Paired Samples9.2.1 Methodology • Data observations (x1, y1), (x2, y2), …, (xn, yn) One sample technique can be applied to the data set zi = xi – yi , 1 ≤ i ≤ n, in order to make inferences about the unknown mean (average difference).
9.2.2 Examples(1/2) • Example 55. Heat Rate Reduction - An initial investigation of the data observations zi reveals that 30 of 40 are negative. This suggests that - -
9.2.2 Examples(2/2) - - - Consequently, the new drug provides a reduction in a patient’s heart rate.
Fig.9.17 p-value=0.0027
Fig.9.19 p-value=0.0023
9.3.4. Examples(1/2) • Example 49. Acrophobia Treatments - general (unpooled) analysis (from Minitab) Fig.9.20 Acrophobia treatment data set (improvement scores)
9.3.4. Examples(2/2) - Analysis using pooled variance * Almost same as in the unpooled case.
9.3.5. Sample Size Calculations • Interest : determination of appropriate sample sizes n and m, or an assessment of the precision afforded by given sample sizes
to meet the specified goal, the experimenter can estimate that total sample sizes of n=m=95 will suffice, so that additional sampling of 80 observations from each population.
Summary problems (1) In a one-sample testing problem of means, the rejection region is in the same direction as the alternative hypothesis. (yes) (2) The p-value of a test can be computed without regard to the significance level. (yes) (3) The length of a t-interval is larger than that of a z-interval with the same confidence level. (no) (4) If we know the p-value of a two-sided testing problem of the mean, we can always see whether the mean is contained in a two-sided confidence interval. (yes) (5) Independent sample problems may be handled as paired sample problems. (no)
Homework #9: • Read Chapter 9. • Do the following problems: 9.2.2, 9.2.6, 9.3.6, 9.3.10 9.6.9, 9.6.10, 9.6.15, 9.6.17 Due date: 11/19