Chapter 2: Comparing Means
3. Chapter 2: Comparing Means. 3. Chapter 2: Comparing Means. Objectives . Use JMP to evaluate the t -test assumption of normality. Construct lower-tailed, upper-tailed, and two-tailed hypothesis tests using the t -test.

Chapter 2: Comparing Means
E N D
Presentation Transcript
3 Chapter 2: Comparing Means
3 Chapter 2: Comparing Means
Objectives • Use JMP to evaluate the t-test assumption of normality. • Construct lower-tailed, upper-tailed, and two-tailed hypothesis tests using the t-test. • Identify the appropriate test statistic and hypothesis test to answer a research question.
One-Sample t-Test Assumptions • The one-sample t-test assumes that is normally distributed. • Normal populations yield normal sample means. • Decide whether population is normal based on tests of sample data. • Small samples might weakly support these tests. • Non-normal populations might yield normal sample means. • Large samples benefit from principle of central limit theorem.
Evaluating Normality • In addition to graphical tools, JMP provides a statistical test for normality with the following hypotheses: • H0: the data come from a • normal distribution • H1: the data do not come from • a normal distribution
Statistical Tests for Normality • Three tests are provided by the Distribution platform to assess the normality of the data. • Shapiro-Wilk test for up to 2000 observations. • Kolmogorov-Smirnov-Lilliefors (KSL) test for more than 2000 observations. • Lilliefors confidence region in the normal quantile plot.
One-Sample t-Test Assumptions • The one-sample t-test assumes that observations are independent. • Independence is determined by the data collection method. • An appropriate simple random sample should lead to independent observations. • Advanced methods handle restrictions to the randomization both in the design and in the analysis of data from an experiment.
Three Research Problems • An electronics manufacturer wants to determine whether, on average, its power supplies are supplying significantly more or less than the desired 12 amperes. • An agricultural company is confident that its new fertilizer results in crop yields of more than 55 bushels per acre, on average. • A laboratory group is concerned that the purity of a chemical that it is using is less than 99.4% on average, as the supplier claims.
How to Choose the Appropriate t-Test • Examine the alternative hypothesis to determine what t-test is appropriate. • Use a two-tailed test if you suspect the true mean is different than claimed (H1: 12). • Use an upper-tailed test if you suspect that the true mean is higher than claimed (H1: > 55 ). • Use a lower-tailed test if you suspect that the true mean is lower than claimed (H1: < 99.4).
2.01 Multiple Answer Poll • The null hypothesis is which of the following? (Select all of the correct answers.) • The logical opposite of the alternative hypothesis • The claim that you suspect is true • Always assumed to be true • Your instinct
2.01 Multiple Answer Poll – Correct Answers • The null hypothesis is which of the following? (Select all of the correct answers.) • The logical opposite of the alternative hypothesis • The claim that you suspect is true • Always assumed to be true • Your instinct
Three t-Tests and Their p-Values Two-tailed ( |t| ) Upper-tailed ( > ) Lower-tailed ( < )
2.02 Multiple Choice Poll • A professor suspects her class is performing below the department average of 73%. She decides to test this claim. Which of the following is the correct alternative hypothesis? • μ < .73 • μ > .73 • μ ≠ .73
2.02 Multiple Choice Poll – Correct Answer • A professor suspects her class is performing below the department average of 73%. She decides to test this claim. Which of the following is the correct alternative hypothesis? • μ < .73 • μ > .73 • μ ≠ .73
is the sample mean. is the estimated standard error of the mean. The Test Statistic The statistic follows a t-distribution with mean zero and a standard deviation that depends on the degrees of freedom. where µ0is the hypothesized mean.
Research Question A research company suspects that drivers are going faster than the posted speed limit of 45 mph. Help it test the following hypotheses: H0: ≤ 45 H1: > 45 = 0.05
The Reference Distribution • Compute for your sample and compare the sample t to the reference distribution.
Analysis Workflow • Follow these steps in your analysis: • Plot your data • Diagnose data problems • Perform your analysis / Choose your model • Evaluate model assumptions • Diagnose statistics or model problems • Iterate as necessary
Upper-Tailed Hypothesis Test • This demonstration illustrates the concepts discussed previously.
Setup for the Poll • Examine the Goodness-of-Fit Test output from the demonstration.
2.03 Poll • At α=.05, is there sufficient evidence to reject normality of the data? • Yes • No
2.03 Poll – Correct Answer • At α=.05, is there sufficient evidence to reject normality of the data? • Yes • No
Exercise • This exercise reinforces the concepts discussed previously.
2.04 Multiple Choice Poll • In the exercise, a one-sample t-test examined whether the average weight of cereal boxes was significantly different from 15. What type of test was run? • An upper-tailed test • A lower-tailed test • A two-sided test
2.04 Multiple Choice Poll – Correct Answer • In the exercise, a one-sample t-test examined whether the average weight of cereal boxes was significantly different from 15. What type of test was run? • An upper-tailed test • A lower-tailed test • A two-sided test
3 Chapter 2: Comparing Means
Objectives • Recognize when a paired t-test is appropriate. • Perform a paired t-test.
Paired t-Test • A paired t-test is a one-sample t-test on the mean of the differences between paired observations. A paired t-test tests the following hypotheses: • where d is the difference between paired measurements. H0: µd = 0 H1: µd 0
The Test Statistic • Use this test statistic to determine whether two means from paired samples differ: • where • is the meandifference between the paired observations (di = y2i – y1i). • is the hypothesized mean difference (H0: µd = 0). • is the standard error of the meandifference.
Paired t-Test Assumptions • The assumptions of the paired t-test are as follows: • is normally distributed • measurements among subjects are independent • the difference should not be proportional to the response
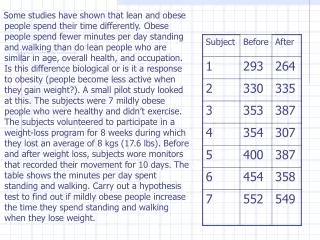
Total Cholesterol Example • A clinical chemist is interested in whether cholesterol measurements are different for pairs of fresh and frozen serum samples obtained from a group of patients.
Paired t-Test • This demonstration illustrates the concepts discussed previously.
2.05 Multiple Answer Poll • Which of the following statements are true? • A paired t-test is the same as a one-sample t-test on the differences. • The Matched Pairs platform in JMP allows an evaluation of the relationship, if any, between the differences and the response level. • A paired t-test is used when pairs of observations are related.
2.05 Multiple Answer Poll – Correct Answers • Which of the following statements are true? • A paired t-test is the same as a one-sample t-test on the differences. • The Matched Pairs platform in JMP allows an evaluation of the relationship, if any, between the differences and the response level. • A paired t-test is used when pairs of observations are related.
Exercise • This exercise reinforces the concepts discussed previously.
2.06 Quiz • Examine the output from the exercise. What is the conclusion from these comparisons of blood pressure before and after the training?
2.06 Quiz – Correct Answer • Examine the output from the exercise. What is the conclusion from these comparisons of blood pressure before and after the training? • The 95% confidence interval on the true average does not contain zero in either case, so this indicates that there is a difference, on average, between the blood pressure readings before and after the training.
3 Chapter 2: Comparing Means
Objectives • Distinguish between a two-sample t-test and a paired t-test. • Identify the three assumptions of a two-sample t-test. • Compare the means of two populations using a two-sample t-test.
Two-Sample t-Test or Paired t-Test? • A two-sample t-test, or independent t-test, is used when you compare the means of two independent populations. • A paired t-test is used when there are pairs of related measurements.
2.07 Multiple Choice Poll • Suppose that you are interested in evaluating the effect of a marketing campaign on regional retail sales. You collect data before and after the campaign for each retail facility. Which is the more appropriate test? • One-sample t-test • Paired t-test • Two-sample t-test • Any of these tests could be appropriate.
2.07 Multiple Choice Poll – Correct Answer • Suppose that you are interested in evaluating the effect of a marketing campaign on regional retail sales. You collect data before and after the campaign for each retail facility. Which is the more appropriate test? • One-sample t-test • Paired t-test • Two-sample t-test • Any of these tests could be appropriate.
Concrete Example Reinforced Standard
Statistical Assumptions • Independent observations • is normally distributed for each population • Equal variances for each population µ2 µ1
where is the test statistic. is the mean for the sample from population i (i=1, 2). is the pooled standard error. The Test Statistic • Use this t-test to test whether the means of two independent groups are different:
Example of a Two-Sided Hypothesis • Suppose you are interested in determining whether two group means are different from one another. The null and alternative hypotheses are the following: • H0: the group means are identical (1 = 2) • H1: the group means are different (12)
Comparing Two Means Using a t-Test • This demonstration illustrates the concepts discussed previously.
Setup for the Poll • Examine the output of the tests of equal variances.