Comparing 2 Population Means
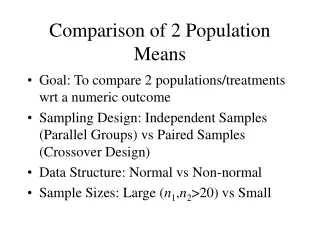
Comparing 2 Population Means. Goal is to compare the mean response (or other quantity) of two different populations. We sample from two groups of individuals. We have one measurement or observation per individual. These two groups are assumed to be independent .

Comparing 2 Population Means
E N D
Presentation Transcript
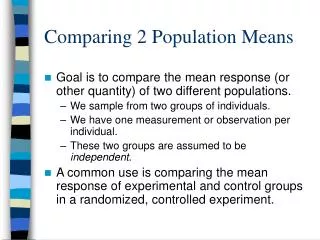
Comparing 2 Population Means • Goal is to compare the mean response (or other quantity) of two different populations. • We sample from two groups of individuals. • We have one measurement or observation per individual. • These two groups are assumed to be independent. • A common use is comparing the mean response of experimental and control groups in a randomized, controlled experiment.
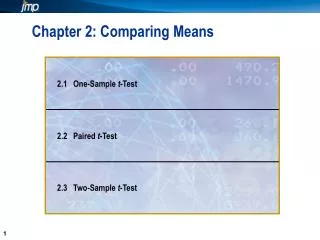
Formulating hypotheses • Label the means of populations 1 and 2 as m1 and m2. • Null hypothesis says mean population responses are the same • H0: m1 - m2= 0. • Possible alternative hypotheses: • Ha: m1 - m2> 0 (population 1 mean bigger) • Ha: m1 - m2< 0 (population 2 mean bigger) • Ha: m1 - m2 0 (means are different)
What test statistic do we use? • To estimate m1 – m2, we use , where is the sample mean from population 1 and is the sample mean from population 2.
Two-sample t procedures • We rarely know s1 and s2 (the standard deviations of the two populations). • As in the case of the one-sample test for m, if we don’t know s, we estimate it using s (sample standard deviation). • Since we made 2 estimates, our test statistic doesn’t have an exact t distribution (except in the special case that s1 = s2).
Two-Sample t Statistic With H0: m1m2 and n1 and n2 being the sample sizes from populations 1 and 2, respectively.
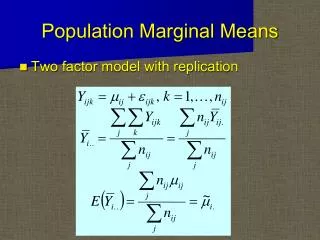
Approximating the t distribution for a 2-sample test statistic • We can approximate the distribution of a 2-sample test statistic using a t distribution – the trick is figuring out the degrees of freedom (d.f.). • We can approximate the d.f. with the smaller of (n1 1) and (n21). • Software allows for a slightly better approximation. • These methods yield similar results, with the first being more conservative.
Ex: Accountants vs. Planners • Random samples of accountants and financial planners were taken • The groups were asked about their starting salaries. • Is there a significant difference in mean starting salaries? Use alpha=10%. • Data in P:\Data\MATH\Swall\plan&cpa.mtw
Robustness of 2-sample procedures • In general, 2-sample t procedures are more robust than 1-sample t methods. • When the 2 population distributions have similar shapes and the sample sizes are equal, the t procedures can be used for small sample sizes. • Larger sample sizes are needed when population distributions have different shapes. • Procedures are more robust when sample sizes equal.
Two-Sample t CIs • The confidence interval for m1 – m2 given byhas confidence level C. Here, t* is the value of the t(k) distribution with area C between –t* and t*. The degrees of freedom (k) are estimated by software or chosen to be the smaller of n1–1 and n2–1.
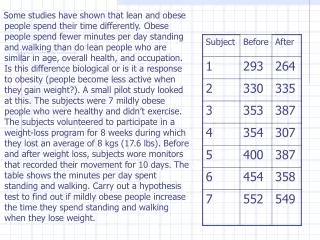
Example • Pat wants to compare the cost of one- and two-bedroom apartments locally. She collects data for a random sample of 10 advertisements of each type. • Here are the rents for the two-bedroom apartments (in $/month):595, 500, 580, 650, 675, 675, 750, 500, 495, 670 • Here are the rents for one-bedroom apartments:500, 650, 600, 505, 450, 550, 515, 495, 650, 395 • Find a 95% CI for the additional cost of a second bedroom.
Example • A study of iron deficiency among infants compared samples of infants following different feeding regimens. One group contained breast-fed infant, while children in another group were fed a standard baby formula without any iron supplements. Here are summary results on blood hemoglobin levels at 12 months of age:Is there significant evidence that the mean hemoglobin level is higher among breast-fed babies?