ABSTRACT
MODELLING DISCHARGE AND NITROGEN FLUXES FROM LARGE WATERSHEDS IN THE NORTHEASTERN UNITED STATES D. P. Swaney 1 * , R. W. Howarth 1 , A. E. Galford 1 , E.W. Boyer 2 , C.L. Goodale 1 and R.M. Marino 1 1 Cornell University, Ithaca, NY USA

ABSTRACT
E N D
Presentation Transcript
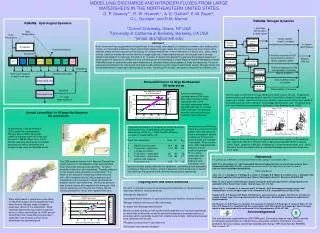
MODELLING DISCHARGE AND NITROGEN FLUXES FROM LARGE WATERSHEDS IN THE NORTHEASTERN UNITED STATES D. P. Swaney1*, R. W. Howarth1 , A. E. Galford1, E.W. Boyer2, C.L. Goodale1 and R.M. Marino1 1Cornell University, Ithaca, NY USA 2University of California at Berkeley, Berkeley, CA USA *(email: dps1@cornell.edu) Barren Open Water Wetland Row crops Vineyards/ orchards Forest Shrubland ReNuMa: Nitrogen Dynamics Landscape denitrification & other losses Direct addition (load) to streams Wastewater Treatment Plants Human Waste In-stream denitrification Onsite treatment Manure Threshold response in DIN concentrations similar to Billen &Garnier (2000) Riverine DIN flux Fertilizer Agricultural Landuses Agricultural N-Fixation Threshold response in DIN concentrations following Aber et al (2003) Forest & shrubland Atmos Deposition Water & wetland Direct addition (load) to streams Urban & barren Direct addition to streams ReNuMa: Hydrological Dynamics Daily Temperature Daily Precipitation ABSTRACT Much recent work has suggested that nitrogen fluxes to the coastal zone depend on interactions between input loading rates, climate, and landscape processes. Direct relationships between nitrogen inputs and riverine fluxes have been shown with a relatively simple nitrogen accounting methodology for 16 large watersheds in the northeastern US (Boyer et al., 2002). More recently, statistical models have shown that the average response of these watersheds per unit nitrogen load is strongly related to precipitation or hydrology (Howarth et al., in press). To extend this approach to examine the temporal response of these systems in response to climate and land use change, we are developing a simple Regional Nutrient Management model (ReNuMa) based on watershed-scale water balances and statistical relationships between N loads and responses. For the 6-year period examined so far, interannual discharge is well predicted over the range of watersheds studied. Nitrogen fluxes vary across watersheds in response to anthropogenic sources, including point sources, atmospheric deposition and fertilizer use. Snowpack Evapotranspiration Snowmelt Urban Streamflow SCS runoff equation for each cover type Shallow flow/runoff Unsaturated zone Annual DIN flux in 16 large Northeastern US watersheds Baseflow Saturated zone Across all watersheds, simulated annual DIN fluxes also match observed values reasonably well. Some individual watersheds exhibit significant bias above or below observed fluxes, but generally correlate with annual changes variations reasonably well. Human waste contributes N through sewers and septic system effluent. N deposition traverses lakes and wetlands without retention, but exhibits a threshold landscape response in forests. Agricultural N sources (fertilizer, manure and fixation) also exhibit a threshold response due to retention (ie landscape denitrification, etc). The proportions of in-river denitrification are based on estimates in Van Breemen et al., 2002) (1st order linear reservoir) Annual streamflow in 16 large Northeastern US watersheds Simulated annual DIN fluxes improve as more sources are added. Here, the scenarios show the increase in several goodness-of-fit measures as more terms are included in the model. Point sources alone (#5) underpredict the DIN load, but still exhibit a significant R2 (ie a linear relationship with observations). Adding a fixed contribution from Preliminary comparison of simulated vs observed annual DIN fluxes for the 12 watersheds with adequate observations of DIN; ENS = Nash-Sutcliffe efficiency; n=6 years*12 watersheds =72) ------------------------------------------------------------------------------ Run# Run description Bias R2 ENS ------------------------------------------------------------------------------ 1 Baseline (all sources) +6.4 .89 .88 2 Pt sources + agriculture -17.5 .86 .84 + N dep (no forest) 3 Pt sources + agriculture -82 .90 .78 4 Pt sources + agriculture -142 .83 .57 without load response 5 Pt sources only -225 .71 .13 16 watersheds in the Northeastern USA in which Net Anthropogenic Nitrogen Inputs (NANI) have been related to average riverine N fluxes over the period 1988-93 (Boyer et al., 2002). We are extending the analysis to simulate seasonal and annual streamflow and nitrogen fluxes using the ReNuMa model. Examples of threshold responses in agricultural and forest systems in the literature. Left: response of [NO3] to fertilizer loads in agricultural leachate (Billen & Garnier, 2000); Right: response of [NO3] to N deposition in forest leachate (Aber, et al., 2003). We use a similar parameterization to estimate landscape response from these land cover types. References The predecessor of ReNuMa is the Generalized Watershed Loading Function Model (GWLF): Haith, D. A., Shoemaker, L. L. 1987. Generalized watershed loading functions for stream flow nutrients. Water Resources Bulletin 23(3):471-478. A spreadsheet-based version of the model can be found on the web at: http://cfe.cornell.edu/biogeo/USGSWRI.htm. Other references The 2928 weather stations in the National Climate Data Center network for Northeastern states were identified (http://www.ncdc.noaa.gov/oa/ncdc.html). To select candidate stations for each watershed, Thiessen polygons for the network were generated using ArcView™ 3.2. Stations with polygons intersecting a watershed and with >95% complete records (daily temperature and precipitation) were averaged to obtain representative weather data for each watershed. Missing temperature data for each station were replaced with averages of the records preceding and following the missing interval; missing precipitation values were replaced with zero. agricultural lands greatly improves the agreement, and adding a load-dependent contribution improves it further. Direct N deposition and the response of forests also improves the agreement with observed fluxes across watersheds. Aber, J. D., C. L. Goodale, S. V. Ollinger, M.-L. Smith, A. H. Magill, M. E. Martin, R. A. Hallett, and J. L. Stoddard. 2003. Is Nitrogen Deposition Altering the Nitrogen Status of Northeastern Forests? Bioscience 54(4):375-389. Billen, G. and J. Garnier. 2000. Nitrogen transfers through the Seine drainage network: a budget based on the application of the ‘Riverstrahler’ model. Hydrobiologia. 410: 139–150. Boyer, E.W., C. L. Goodale, N. A. Jaworski and R. W. Howarth. 2002. Anthropogenic nitrogen sources and relationships to riverine nitrogen export in the northeastern U.S.A. Biogeochemistry 57/58:137-169. Howarth, R.W., D.P. Swaney, E.W. Boyer, R.M. Marino, N. Jaworski and C.L. Goodale. The influence of climate on average nitrogen export from large watersheds in the Northeastern United States. Accepted for publication in Biogeochemistry. Van Breemen, N., E.W. Boyer, C.L. Goodale, N.A. Jaworski, K. Paustian, S.P. Seitzinger, K. Lajtha, B. Mayer, D. Van Dam, R.W. Howarth, K.J. Nadelhoffer, M. Eve, and G. Billen. 2002. Where did all the nitrogen go? Fate of nitrogen inputs to large watersheds in the northeastern U.S.A. Biogeochemistry 57/58: 267–293. Ongoing work and future directions • Our work to date has focused on developing parameterizations of biogeochemical responses related to landuse/landcover: • Atmospheric deposition • Landscape level N retention of agricultural N sources (fertilizer, manure, N-fixation) • Nitrogen retention and losses (DIN) from forests • In-stream and landscape denitrification • We are currently working on refining the model parameters for individual watersheds to reduce bias at this scale, as well as developing alternative parameterizations of processes which incorporate results from smaller-scale models. Additional processes to be considered will include: • Phosphorus losses from P-saturated soils • Soil erosion and sediment transport Minor adjustments to evaporative cover factor for the Androscoggin and Susquehanna rivers were the only changes made to baseline parameter values for the watersheds. While individual watersheds may exhibit some bias above or below observations (ie USGS annual streamflows http://waterdata.usgs.gov/nwis/ ), agreement over all years and across all watersheds was generally good. Acknowledgements This work has been supported by an EPA STAR grant, “Developing regional-scale stressor models for managing eutrophication in coastal marine ecosystems, including interactions of nutrients, sediments, land-use change, and climate variability and change,” EPA Grant Number R830882, R.W. Howarth, P.I.