Download
1 / 32
330 likes | 454 Views
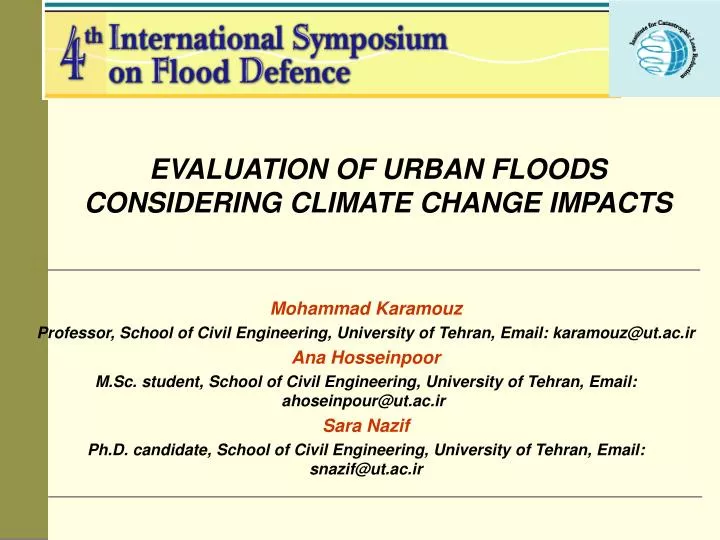
EVALUATION OF URBAN FLOODS CONSIDERING CLIMATE CHANGE IMPACTS. Mohammad Karamouz Professor, School of Civil Engineering, University of Tehran, Email : karamouz@ut . ac . ir Ana Hosseinpoor M . Sc . student, School of Civil Engineering, University of Tehran, Email : ahoseinpour@ut.ac.ir

E N D
EVALUATION OF URBAN FLOODS CONSIDERING CLIMATE CHANGE IMPACTS • Mohammad Karamouz • Professor, School of Civil Engineering, University of Tehran, Email: karamouz@ut.ac.ir • Ana Hosseinpoor • M.Sc. student, School of Civil Engineering, University of Tehran, Email: ahoseinpour@ut.ac.ir • Sara Nazif • Ph.D. candidate, School of Civil Engineering, University of Tehran, Email: snazif@ut.ac.ir
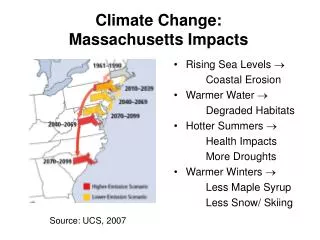
Introduction The urban floods could be very destructive in high population density zone and in centers of economic and industrial activities. The urbanization changes natural morphology of local rivers and often decreases their natural carrying capacity resulting from various activities and therefore intensifies the risk of urban floods. The effects of climate change on hydrologic cycle have led to increased concerns about urban flood events especially in mega cities of the developing countries. In this Study, the performance of drainage system of northern part of Tehran metropolitan area (capital of Iran) has been investigated
Case study • The northeastern part of Tehran • 51º-22´ and 51 º-30´ longitudes • 35º -42´ and 35º -53´ latitudes • Includes • Darband sub-basin(zone 1) • Golabdare sub-basin(zone 2) • Velenjak sub-basin(zone 3) • Sadabad sub-basin(zone 4) • Kashanak sub-basin(zone 5) • Jamshidie sub-basin(zone 6) • Zones 7- 19
Case study Types of channels Natural Man made average slope:About 21%. The percentage ofimpervious area:85% Thealtitude:Between 1290 m and 3900 m. Total drainagearea: About 110 km²
Case study Data: Therainfall dataatRoodakstation located in latitude 35º-51´ and longitude 51º-33´ with adequate recorded data which is out of the study area has been considered as a representative of the rainfall data of the study area. TheGhasr station snow datahas been used which is available between years 1975 and 1995. Mehrabad (synoptic station )is used as a source forwind and temperature datawhich is about 10 Km away from the study area.
Case study Three scenarioshave been considered for studied area drainage system modeling as follows: Scenario 1: The surface water collection system in about 10 years ago. The model for this scenario is developed to evaluate the effectiveness of development projects done in the recent years. Scenario 2: The present situation of surface water collection system. Scenario 3: The future plans for improving and development of case study drainage system have been modeled in this scenario.
(b) Scenario 2 (Present) (c) Scenario 3 (Future) (a) Scenario 1 (Past) Case study Added abundant Differences between considered scenarios
Case study The characteristics of the different scenarios for water drainage system
Case study Governing Parameters in the scenarios: The channel coverage and alignment The number and placement of detention ponds The land use and percentage of pervious area
Methodology For evaluation of climate change effects on urban floods a statistical downscaling model (SDSM) developed by wilby et al. (2004) is used. The drainage system of the study area has been simulated using StormNET model. The critical rainfall that may result in probable floods in the region are those which satisfy the following inequality: Where μі and σі are the average and standard division of rainfall in season i of the rainfall series, respectively. Rxi is considered the extreme rainfall in season i
Methodology The effects of climate change on the magnitude and frequency of the extreme seasonal rainfalls in the future are evaluated. The hydraulic model of the drainage system is calibrated. The impact of rainfalls with different return periods is evaluated running the hydraulic simulation model for the three pre-defined scenarios in the study area.
Methodology Rainfall downscaling: SDSM carries five distinct tasks: Screening of potential downscaling predictors Assembly and calibration of model Synthesis of ensembles of current weather data using observed predictors Generation of ensembles of future weather data using GCM-derived predictor variables Diagnostic testing/analysis of observed data and climate change scenarios
Methodology Rainfall downscaling: SDSM model has been used for long-lead rainfall prediction and downscaling for an individual site on a daily time–scale, by using GCM outputs. During the downscaling with the SDSM, a multiple linear regression model is developed using selected large-scale predictors and the local rainfall. Large-scale relevant predictors are selected using correlation analysis, partial correlation analysis and scatter plots, considering the sensitivity between the selected predictors and rainfall for the region
Methodology Hydraulic modeling of urban drainage system : The StormNET model developed by Boss International (2005) has been used for simulation of the urban drainage system. StormNET is a link-node based model that performs hydrology, hydraulic, and water quality analysis of stormwater and wastewater drainage systems.
Methodology Hydraulic modeling of urban drainage system : The StormNET model needs some data on: Sub-basin (total area, pervious and impervious area, manning’s roughness,…) Detention pond (shape of detention pond, elevation,…) Flow diversion Snow pack Rainfall hyetograph Channel and pipe links (shape, manning’s roughness,…)
Methodology Hydraulic modeling of urban drainage system: It is important to consider the resulted runoff due to snow melting in modeling of the drainage system. The snow melt coefficient has been calculated as follows: M is snowmelt runoff (mm), D is average number of degree day above zero (the snow melt base temperature has been determined 0°c for Tehran) and K is the snowmelt coefficient. The following degree-day equation has been used to compute the melt rate: Melt Rate = (Melt Coefficient) (Air Temperature - Base Temperature)
Methodology Hydraulic modeling of urban drainage system : The SANTA BARBARA method :Simulation of sub-basin runoff The KIRPICH method: Estimation of the basins time of concentration. The Manning's roughness for pervious area 0.015 The Manning's roughness for impervious area .0149. The soil property group D CN of the pervious area varies between 76 and 84.
Results> Downscaling Daily rainfall data at Roodak station has been transformed by the second root function to better fit normal distribution The correlations between different combinations of available predictors and daily rainfall have been calculated to find the most appropriate combination. The combination of 3 predictors is selected 1) relative humidity at 850 hPa height, 2) near surface specific humidity 3) near surface relative humidity. The physical relation between the selected predictors and the rainfall of the study area has been implicitly considered by calculation of P-value between predictors and rainfall. The model has been calibrated with rainfall data of 1977-1984 and validated for the remaining available data (1985-2000).
Results Errors of rainfall prediction include errors of mean and maximum daily rainfall and wet spells, during the validation period for NCEP( National Center For Environmental Prediction) and HadCM3(Second Hadley Centre Coupled Ocean-Atmosphere GCM)
Results • 20 ensemble data of rainfall have been generated.
Results The hydraulic model of the drainage system is calibrated with the observed 1995 flood hydrograph inGolabdareh (zone 2).
Results The severity of wet and dry periods is increasing in the study area due to the effects of climate change The peak volumes of the floods are increasing Increasing the peak volumes lead to considerable damaged and it is necessary to revise the river training projects in the study area Application of some new river training programs for dredging the channels and construction of new detention and retention ponds are needed.
Results No obvious trends in the volume and peak of floods due to climate change effects could be obseved. The man-made channels have changed the characteristics of the drainage system. The positive effects are not uniform. In response to the river training projects in the last 10 years, the flood peaks and volumes have been increased considerably. As the capacity of the system increases, the overflow volumes variations are mixed.
Conclusion In urban areas due to some special characteristics such as the population concentration and limitations on the natural water systems, the effects of climate change are intensified. One of the most important components of urban water cycle is urban runoff which is highly affected by climate change and urbanization. In this study the effects of climate change on urban runoff in the northeast of Tehran is evaluated. The downscaling model has been used to predict the future rainfall and then extreme rainfalls are identified.
Conclusion The characteristics of the extreme rainfall of future years including the frequency and the magnitude are evaluated. It seems that the severity of wet and dry periods is increasing in the study area due to effects of climate change. Further study is needed. The identified extreme rainfalls are applied in a hydraulic simulation model considering the existing and the future expansion of the system.
Conclusion The results show that the peak volumes of the floods are increasing. This may lead to considerable damaged and it is necessary to revise the current plans for river training projects of the drainage channels in the study area. An integrated approach is needed to deal with the combined urban expansion and the climate change impacts.
Thank you for your Attention • For more information please contact: • Mohammad Karamouz: karamouz@ut.ac.ir • Tel: 0098-21-88555884 • Fax:0098-21-88701507
Methodology Hydraulic modeling of urban drainage system : The flow diverted through a weir flow diversion is computed through the following equation: is the diverted flow (m3/s), is weir coefficient, is weir height. f is a coefficient that is computed as follows: Qin is inflow to the flow diversion, Qmin is the minimum flow at which flow diversion begins and Qmax is the maximum capacity of the channel. All of the weirs in the system are assumed to be rectangular.
Results The extreme rainfall with different return periods are simulated by three developed hydraulic models.
Results The average of long-term observed rainfall has been compared to the rainfall using NCEP signal and modeled rainfall using HADCM3 One of the predicted scenarios for future climate variation named HadCM3 (Second Hadley Centre Coupled Ocean-Atmosphere GCM) is used as the model input signal and rainfall is predicted