Download
1 / 11
110 likes | 149 Views
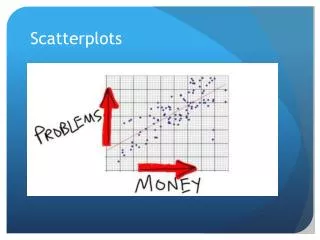
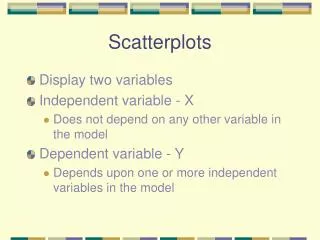
2-1 INTERPRET SCATTERPLOTS. OBJECTIVES. Graph bivariate data. Interpret trends based on scatterplots. data univariate data bivariate data scatterplot trend correlation. positive correlation negative correlation causal relationship explanatory variable response variable.

E N D
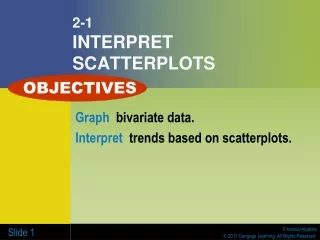
2-1INTERPRET SCATTERPLOTS OBJECTIVES Graphbivariate data. Interprettrends based on scatterplots.
data univariate data bivariate data scatterplot trend correlation positive correlation negative correlation causal relationship explanatory variable response variable Key Terms
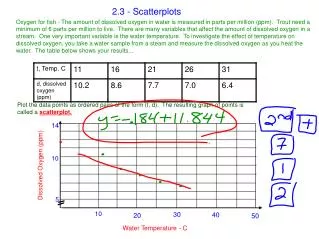
Example 1 Rachael runs a concession stand at the park, where she sells water bottles. She keeps a list of each day’s high temperature and the number of water bottles she sells each day. Rachael is looking for trends that relate the daily high temperature to the number of water bottles she sells each day. She thinks these two variables might be related and wants to investigate possible trends using a scatterplot. Below is the list of her ordered pairs. (65, 102), (71, 133), (79, 144), (80, 161), (86, 191), (86, 207), (91, 235), (95, 237), (100, 243) Construct a scatterplot by hand on graph paper.
CHECK YOUR UNDERSTANDING If the temperature reaches 68 degrees Fahrenheit tomorrow, about how many water bottles do you predict will be sold? Explain.
Example 2 Rachael wants to interpret the trend shown in the scatterplot. What do you notice about the relationship between temperature and water bottle sales? Is there an explanatory variable and a response variable?
CHECK YOUR UNDERSTANDING A local coffee shop sells hot chocolate. The manager keeps track of the temperature for the entire year and the hot chocolate sales. A scatterplot is graphed with temperature on the horizontal axis and hot chocolate sales on the vertical axis. Do you think the scatterplot shows a positive or negative correlation? Is there causation? Explain.
EXAMPLE 3 Determine if the following scatterplot depicts a positive correlation or a negative correlation.
CHECK YOUR UNDERSTANDING A local medical school is studying growth of students in grades 1–12. The height of each student in inches and the length of each student’s foot in centimeters is recorded, and a scatterplot is constructed. Do you think the scatterplot shows a positive correlation or a negative correlation? Is there causation?
EXAMPLE 4 An elementary school principal compiled the following data about ten students at Compsett Elementary School. The first number represents a student’s height in inches. The second number is the student’s reading level. Create a scatterplot of the data. Do you think a person’s height causes a higher reading level?
EXAMPLE 5 The scatterplot shows the relationship between the number of text messages made by each of ten juniors while studying for Mr. Galati’s chemistry test last week and their scores on the test. Describe the trends you see in the data.
CHECK YOUR UNDERSTANDING Students in a biology class measure the circumference and diameter of every tree on the school property. The students create a table of ordered pairs and plan to draw a scatterplot. Should there be a positive correlation, a negative correlation, or no correlation?