Download
1 / 37
370 likes | 1.08k Views
2. Topics for this chapter. Acid base reactions and their importanceCarbonate system and their importance in biogeochemical reactionspH range and controlling factors in the natural waters. 3. Objectives. Better understand acid-base equilibrium in natural watersBetter understand carbonate speci

E N D
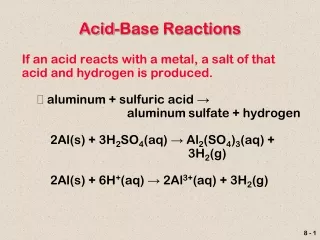
1. 1 Acid-base reactions and carbonate system
2. 2 Topics for this chapter Acid base reactions and their importance
Carbonate system and their importance in biogeochemical reactions
pH range and controlling factors in the natural waters
3. 3 Objectives Better understand acid-base equilibrium in natural waters
Better understand carbonate species change and alkalinity measurement
Understand the method to study species distributions in natural waters
4. 4 DEFINITION: ACIDS AND BASES Bronsted definition
Acid: any substance that can donate a proton
Base: any substance that can accept a proton
HCl(aq) ? H+ + Cl-
NaOH(aq) + H+ ? Na+ + H2O(l)
Lewis definition:
Acid: any substance that can accept electrons
Base: any substance that can donate electrons
H3BO3(aq) + OH- ? B(OH)4-
H2O(l) ? H+ + OH-
H3BO3(aq) + H2O(l) ? B(OH)4- + H+
5. 5
6. 6
7. 7 THE HYDRONIUM ION The proton does not actually exist in aqueous solution as a bare H+ ion.
The proton exists as the hydronium ion (H3O+).
Consider the acid-base reaction:
HCO3- + H2O ? H3O+ + CO32-
Here water acts as a base, producing the hydronium ion as its conjugate acid. For simplicity, we often just write this reaction as:
HCO3- ? H+ + CO32- Bare protons do not exist in aqueous solutions. The H+ ion, being quite small, has a strong tendency to attract the negative end of polar water molecules to it; in other words, the proton is strongly hydrated (see lecture 1). We often write the hydrated proton as the hydronium ion, H3O+. In fact, the proton is almost certainly hydrated by more than one water molecule, and it might be more appropriate to write the hydrated proton with four water molecules, e.g., H9O4+, or perhaps even a larger number of waters of hydration. However, as long as we keep the hydration of the proton in mind, it is permissible to write reactions in terms of H+ for simplicity. From a thermodynamic point of view, it does not matter whether H+ is hydrated or not, because thermodynamics deals only with macroscopic properties. On the other hand, the hydration of the proton needs to be taken into account when considering reaction mechanisms or kinetics. Bare protons do not exist in aqueous solutions. The H+ ion, being quite small, has a strong tendency to attract the negative end of polar water molecules to it; in other words, the proton is strongly hydrated (see lecture 1). We often write the hydrated proton as the hydronium ion, H3O+. In fact, the proton is almost certainly hydrated by more than one water molecule, and it might be more appropriate to write the hydrated proton with four water molecules, e.g., H9O4+, or perhaps even a larger number of waters of hydration. However, as long as we keep the hydration of the proton in mind, it is permissible to write reactions in terms of H+ for simplicity. From a thermodynamic point of view, it does not matter whether H+ is hydrated or not, because thermodynamics deals only with macroscopic properties. On the other hand, the hydration of the proton needs to be taken into account when considering reaction mechanisms or kinetics.
8. 8 Expression of acid strength The strength of an acid is expressed by the value of the equilibrium constant for its dissociation reaction.
Consider: H2CO3 ? H+ + HCO3-
The dissociation constant for this reaction at 25�C is:
This can also be expressed as pK a = 6.35.
Bicarbonate is considered to be a relatively weak acid. The strength of an acid HA is measured by the magnitude of the equilibrium constant for the dissociation reaction:
HA0 ? A- + H+
This equilibrium constant is called the dissociation constant and is given the symbol Ka. The larger Ka, the greater the extent of dissociation (the greater its tendency to donate a proton) and the stronger the acid. If Ka is relatively small, the tendency to donate a proton is low, the acid is only slightly dissociated, and we say the acid is weak. Recalling that a �p� in front of any quantity signifies the negative logarithm to the base 10, we can write pKa = -log Ka. Now, an acid with a small pKa is said to be strong, and one with a large pKa is said to be weak. Bicarbonate is an example of a relatively weak acid. Other examples of weak acids are acetic acid (CH3COOH), hydrofluoric acid (HF), hydrogen sulfide (H2S), etc.
Note that, if an acid is polyprotic, i.e., it has more than one proton to donate, it will have more than one pKa value. For example, consider H3PO40:
H3PO40 ? H2PO4- + H+ pK1 = 2.1
H2PO4- ? HPO42- + H+ pK2 = 7.0
HPO42- ? PO43- + H+ pK3 = 12.2 The strength of an acid HA is measured by the magnitude of the equilibrium constant for the dissociation reaction:
HA0 ? A- + H+
This equilibrium constant is called the dissociation constant and is given the symbol Ka. The larger Ka, the greater the extent of dissociation (the greater its tendency to donate a proton) and the stronger the acid. If Ka is relatively small, the tendency to donate a proton is low, the acid is only slightly dissociated, and we say the acid is weak. Recalling that a �p� in front of any quantity signifies the negative logarithm to the base 10, we can write pKa = -log Ka. Now, an acid with a small pKa is said to be strong, and one with a large pKa is said to be weak. Bicarbonate is an example of a relatively weak acid. Other examples of weak acids are acetic acid (CH3COOH), hydrofluoric acid (HF), hydrogen sulfide (H2S), etc.
Note that, if an acid is polyprotic, i.e., it has more than one proton to donate, it will have more than one pKa value. For example, consider H3PO40:
H3PO40 ? H2PO4- + H+ pK1 = 2.1
H2PO4- ? HPO42- + H+ pK2 = 7.0
HPO42- ? PO43- + H+ pK3 = 12.2
9. 9 Strong acids Now consider: HNO3 ? H+ + NO3-
Nitric acid is considered to be a very strong acid; in fact, its pK a is not well defined because the concentration of undissociated acid HNO30 is too small to be measured accurately.
The conjugate bases of weak acids are strong, and the conjugate bases of strong acids are weak.
Thus, NO3- is a very weak base, but CO32- is a comparatively strong base. On the other hand, nitric acid is a very strong acid. The equilibrium:
HNO30 ? H+ + NO3-
lies very far to the right, and HNO30 is nearly completely dissociated. In fact, nitric acid is so strongly dissociated that the activity of HNO30 is extremely small. This means we cannot measure this activity very accurately, so we can not easily measure pKa. Other examples of strong acids include: hydrochloric (HCl), sulfuric (H2SO4) and perchloric (HClO4).
An important rule to keep in mind is that, if an acid is strong, its conjugate base will be weak, and if the acid is weak, then the conjugate base is strong. This makes sense, because if HA is a strong acid, this means that it easily gives up a proton, which means that A- cannot have a very high affinity for protons. Likewise, if HA is a weak acid, this means that it holds on to its protons tenaciously, which means that A- has a strong tendency to accept protons. On the other hand, nitric acid is a very strong acid. The equilibrium:
HNO30 ? H+ + NO3-
lies very far to the right, and HNO30 is nearly completely dissociated. In fact, nitric acid is so strongly dissociated that the activity of HNO30 is extremely small. This means we cannot measure this activity very accurately, so we can not easily measure pKa. Other examples of strong acids include: hydrochloric (HCl), sulfuric (H2SO4) and perchloric (HClO4).
An important rule to keep in mind is that, if an acid is strong, its conjugate base will be weak, and if the acid is weak, then the conjugate base is strong. This makes sense, because if HA is a strong acid, this means that it easily gives up a proton, which means that A- cannot have a very high affinity for protons. Likewise, if HA is a weak acid, this means that it holds on to its protons tenaciously, which means that A- has a strong tendency to accept protons.
10. 10
11. 11
12. 12 DISSOCIATION CONSTANTS OF WEAK ACIDS AT 25�C In this table dissociation constants are given for some acids of geological relevance. Based on the values of pK1, these acids would be ranked in the following order, from strongest to weakest: H2SO3 > H3PO4 ? H3AsO4 > HF > CH3COOH > H2CO3 > H2S > H3BO3 > H4SiO4. Note that, not all hydrogen ions in a compound may dissociate. For example, in boric acid (H3BO3), only one of the three hydrogen ions is acidic and can dissociate, and even this first hydrogen ion leaves boric acid only reluctantly (pKa = 9.2). In this table dissociation constants are given for some acids of geological relevance. Based on the values of pK1, these acids would be ranked in the following order, from strongest to weakest: H2SO3 > H3PO4 ? H3AsO4 > HF > CH3COOH > H2CO3 > H2S > H3BO3 > H4SiO4. Note that, not all hydrogen ions in a compound may dissociate. For example, in boric acid (H3BO3), only one of the three hydrogen ions is acidic and can dissociate, and even this first hydrogen ion leaves boric acid only reluctantly (pKa = 9.2).
13. 13 Range of pH values in the natural environment
14. 14
15. 15 Control of pH on natural reactions The solubility rate of dissolution of most minerals is strongly pH-dependent. Weathering of carbonate, silicate, and alumino-silicate minerals consumes protons and releases metal cations.
Aqueous acid-base equilibria, including hydrolysis and polymerization.
Adsorption, because protons compete with cations and hydroxyl ions compete with anions for adsorption sites. Also, the surface charge of most minerals is pH dependent.
The formation of metal ligand complexes, because protons compete with metal ions to bond with weak-acid ions, and OH- competes with other ligands that would form complexes.
Oxidation-reduction reactions, whether abiological or biologically mediated. Oxidation usually produced protons, whereas reduction consumes them.
16. 16
17. 17 Carbonic acid system: the importance Carbonic acid is the most abundant acid in natural water systems
Carbonic acid is the acid most responsible for rock weathering.
The pH of most natural waters is controlled by reactions involving the carbonate system
Bicarbonate ion is generally the dominant anion in fresh surface- and ground- waters.
Bicarbonate and carbonate ions are the chief contributors to total alkalinity in natural waters.
An example of acid-base systems in general; the species relationship developed for carbonate equilibrium can be used with little modification for equilibira involving such species as phosphate, sulfide, and silicic acid.
18. 18 Unanswered questions from previous chapters Alkalinity = [HCO3�] + 2[CO32-] + [OH�] � [H+] � [HCO3�] +2[CO32�]
� [HCO3�]
[H+] = [HCO3-] + 2[CO32-] + [OH-]
When pH<7,
[H+] � [HCO3-]
Why?
19. 19 THE CO2-H2O SYSTEM Carbonic acid is a weak acid of great importance in natural waters. The first step in its formation is the dissolution of CO2(g) in water according to:
CO2(g) ? CO2(aq)
At equilibrium we have:
Once in solution, CO2(aq) reacts with water to form carbonic acid:
CO2(aq) + H2O(l) ? H2CO30 The equilibrium constant KCO2 is a measure of the solubility of CO2(g) in water. It is sometimes referred to as the Henry�s Law constant. The reaction of CO2(aq) to H2CO30 is relatively slow; it is sufficiently slow that an enzyme is required to accelerate the reaction in the bloodstream.
Note that true H2CO30 is a much stronger acid that CO2(aq). It may not be apparent that CO2(aq) is an acid at all, at least in the Bronsted sense, because there are no protons in its formula. However, one must keep in mind that CO2(aq) is surrounded by water molecules, which do have protons that can be donated. In any given solution, the majority of CO2 is present as CO2(aq) and only a relatively small amount is present as true carbonic acid (H2CO30). For example, the equilibrium constant at 25�C for the reaction:
H2CO30 ? CO2(aq) + H2O(l)
is on the order of 650, indicating that the equilibrium lies far to the right, and CO2(aq) is the dominant species. The equilibrium constant KCO2 is a measure of the solubility of CO2(g) in water. It is sometimes referred to as the Henry�s Law constant. The reaction of CO2(aq) to H2CO30 is relatively slow; it is sufficiently slow that an enzyme is required to accelerate the reaction in the bloodstream.
Note that true H2CO30 is a much stronger acid that CO2(aq). It may not be apparent that CO2(aq) is an acid at all, at least in the Bronsted sense, because there are no protons in its formula. However, one must keep in mind that CO2(aq) is surrounded by water molecules, which do have protons that can be donated. In any given solution, the majority of CO2 is present as CO2(aq) and only a relatively small amount is present as true carbonic acid (H2CO30). For example, the equilibrium constant at 25�C for the reaction:
H2CO30 ? CO2(aq) + H2O(l)
is on the order of 650, indicating that the equilibrium lies far to the right, and CO2(aq) is the dominant species.
20. 20 THE CO2-H2O SYSTEM In practice, CO2(aq) and H2CO30 are combined and this combination is denoted as H2CO3*. It�s formation is dictated by the reaction:
CO2(g) + H2O(l) ? H2CO3*
For which the equilibrium constant at 25�C is:
Most of the dissolved CO2 is actually present as CO2(aq); only a small amount is actually present as true carbonic acid H2CO30. For convenience, both forms of dissolved CO2 are usually lumped together and denoted as H2CO3*. Once again, from a thermodynamic point of view, the exact nature of dissolved carbon dioxide is not important because thermodynamics only deals with macroscopic properties. However, when reaction rates or mechanisms are of interest to us, then the exact species is important. In this course, when we are clearly dealing with thermodynamic considerations and total dissolved CO2 (i.e., H2CO3*) it is permissible to drop the asterisk (*).
A mentioned previously, the reaction:
CO2(aq) + H2O(l) ?? H2CO30
is comparatively slow. It exhibits first-order kinetics with a rate constant at 0�C of k = 2.0?10-3 sec-1. This means that t� = 0.693/(2.0?10-3 sec-1) = 346.5 sec = 5.775 min. In other words, CO2(aq) has a half-life of nearly 6 minutes at this temperature. After 6 minutes, half of the original amount of CO2(aq) will have been converted to H2CO30. For convenience, both forms of dissolved CO2 are usually lumped together and denoted as H2CO3*. Once again, from a thermodynamic point of view, the exact nature of dissolved carbon dioxide is not important because thermodynamics only deals with macroscopic properties. However, when reaction rates or mechanisms are of interest to us, then the exact species is important. In this course, when we are clearly dealing with thermodynamic considerations and total dissolved CO2 (i.e., H2CO3*) it is permissible to drop the asterisk (*).
A mentioned previously, the reaction:
CO2(aq) + H2O(l) ?? H2CO30
is comparatively slow. It exhibits first-order kinetics with a rate constant at 0�C of k = 2.0?10-3 sec-1. This means that t� = 0.693/(2.0?10-3 sec-1) = 346.5 sec = 5.775 min. In other words, CO2(aq) has a half-life of nearly 6 minutes at this temperature. After 6 minutes, half of the original amount of CO2(aq) will have been converted to H2CO30.
21. 21 THE CO2-H2O SYSTEM Carbonic acid (H2CO3*) is a weak acid that dissociates according to:
H2CO3* ? HCO3- + H+
For which the dissociation constant at 25�C and 1 bar is:
Bicarbonate then dissociates according to:
HCO3- ? CO32- + H+
Although H2CO3* is quite a weak acid, it is important to keep in mind that true carbonic acid, H2CO30, is a much stronger acid. For example,
H2CO30 ? HCO3- + H+
has a pKa value of 3.4-3.8, as opposed to 6.35 for H2CO3*. The reason the latter is a much weaker acid is because CO2(aq) is a much weaker acid, it is present in much higher quantity than H2CO30, and the kinetics of conversion of CO2(aq) to H2CO30 are quite slow.
22. 22 THE RELATIONSHIP BETWEEN H2CO3* AND HCO3- We can rearrange the expression for K1 to obtain:
This equation shows that, when pH = pK1 (when pH = 6.35), the activities of carbonic acid and bicarbonate are equal.
We can also rearrange the expression for K2 to obtain:
This equation shows that, when pH = pK2 (when pH = 10.33), the activities of bicarbonate and carbonate ion are equal. Simple rearrangement of the equilibrium constants for the first and second dissociation reactions of H2CO3* leads to the equations shown in this slide. If we take the logarithm of these two equations and rearrange them further (make sure you can do this!), we obtain:
pH = pK1 + log (aHCO3-/aH2CO3*)
and
pH = pK2 + log (aCO32-/aHCO3-)
These equations demonstrate that when pH = pKa, the activities of the two species involved are equal. If pH < pKa, then the acidic (more protonated) species has a higher activity (is dominant), whereas if pH > pKa, the more basic (less protonated) species has a higher activity (is dominant).
For example, at 25�C, if pH = pK1 = 6.36, the activities of carbonic acid (H2CO3*) and bicarbonate (HCO3-) are equal. At pH < 6.35, carbonic acid is predominant, and at pH > 6.35, bicarbonate is the dominant species. Simple rearrangement of the equilibrium constants for the first and second dissociation reactions of H2CO3* leads to the equations shown in this slide. If we take the logarithm of these two equations and rearrange them further (make sure you can do this!), we obtain:
pH = pK1 + log (aHCO3-/aH2CO3*)
and
pH = pK2 + log (aCO32-/aHCO3-)
These equations demonstrate that when pH = pKa, the activities of the two species involved are equal. If pH < pKa, then the acidic (more protonated) species has a higher activity (is dominant), whereas if pH > pKa, the more basic (less protonated) species has a higher activity (is dominant).
For example, at 25�C, if pH = pK1 = 6.36, the activities of carbonic acid (H2CO3*) and bicarbonate (HCO3-) are equal. At pH < 6.35, carbonic acid is predominant, and at pH > 6.35, bicarbonate is the dominant species.
23. 23 BJERRUM PLOTS Plot of the log of the concentrations of various species in a closed CO2-H2O system as a function of pH.
The species in the CO2-H2O system: H2CO3*, HCO3-, CO32-, H+, and OH-.
At each pK value, conjugate acid-base pairs have equal concentrations, and
At pH < pK1, H2CO3* is predominant, and accounts for nearly 100% of total carbonate.
pH < 6.35
At pK1 < pH < pK2, HCO3- is predominant, and accounts for nearly 100% of total carbonate.
6.35 < pH < 10.33
At pH > pK2, CO32- is predominant.
pH < 10.33 A Bjerrum plot shows the relative importance of the various species in an acid-base system under closed conditions (i.e., the total concentration of all species is constant). For example, for the CO2-H2O system, a Bjerrum plot shows the concentrations of H2CO3*, HCO3-, CO32-, H+, and OH-, under the condition that the sum of the concentrations of H2CO3*, HCO3- and CO32- is constant. The Bjerrum plot is constructed based partially on the concepts discussed in slide 6. That is: 1) At each pK value, conjugate acid-base pairs have equal concentrations; 2) At pH < pK1, H2CO3* is predominant, and accounts for nearly 100% of total carbonate; 3) At pK1 < pH < pK2, HCO3- is predominant, and accounts for nearly 100% of total carbonate; and 4) At pH > pK2, CO32- is predominant. The Bjerrum plot is also constructed assuming that activity coefficients can be neglected. When pH < pK1, and H2CO3* is predominant, the concentrations/activities of the other carbonate species can be derived by rearranging the mass-action expressions for the dissociation reactions, and the mass-balance constraint that the sum of the concentrations of H2CO3*, HCO3- and CO32- is constant. For example, rearranging the equation given in the notes to slide 6 yields:
log aHCO3- = pH - pK1 + log aH2CO3*
At pH < pK1, the concentration of H2CO3* is approximately equal to the total concentration of all carbonate species, and is hence, approximately constant. Thus, the equation shows that, at pH < pK1, the concentration of bicarbonate increases one log unit for each unit increase in pH. Similar equations can be derived for all the carbonate species in each of the pH ranges of the diagram. For more details, consult Faure (1998) Principles and Applications of Geochemistry, Prentice-Hall (Chapter 9, pp. 123-124). A Bjerrum plot shows the relative importance of the various species in an acid-base system under closed conditions (i.e., the total concentration of all species is constant). For example, for the CO2-H2O system, a Bjerrum plot shows the concentrations of H2CO3*, HCO3-, CO32-, H+, and OH-, under the condition that the sum of the concentrations of H2CO3*, HCO3- and CO32- is constant. The Bjerrum plot is constructed based partially on the concepts discussed in slide 6. That is: 1) At each pK value, conjugate acid-base pairs have equal concentrations; 2) At pH < pK1, H2CO3* is predominant, and accounts for nearly 100% of total carbonate; 3) At pK1 < pH < pK2, HCO3- is predominant, and accounts for nearly 100% of total carbonate; and 4) At pH > pK2, CO32- is predominant. The Bjerrum plot is also constructed assuming that activity coefficients can be neglected. When pH < pK1, and H2CO3* is predominant, the concentrations/activities of the other carbonate species can be derived by rearranging the mass-action expressions for the dissociation reactions, and the mass-balance constraint that the sum of the concentrations of H2CO3*, HCO3- and CO32- is constant. For example, rearranging the equation given in the notes to slide 6 yields:
log aHCO3- = pH - pK1 + log aH2CO3*
At pH < pK1, the concentration of H2CO3* is approximately equal to the total concentration of all carbonate species, and is hence, approximately constant. Thus, the equation shows that, at pH < pK1, the concentration of bicarbonate increases one log unit for each unit increase in pH. Similar equations can be derived for all the carbonate species in each of the pH ranges of the diagram. For more details, consult Faure (1998) Principles and Applications of Geochemistry, Prentice-Hall (Chapter 9, pp. 123-124).
24. 24 Although Bjerrum plots can be constructed rigorously by solving the combined mass-action and mass-balance expressions in the system for the concentrations of each of the species, there is a faster, approximate route to the construction of these diagrams. Once the total carbonate concentration (CT) is chosen and the pK values are known, the first step is to plot points with pH coordinates equal to the pK values, and concentration coordinates equal to log CT - 0.301. At pH = pK, the concentrations of two species are equal, and therefore equal to CT/2, the log of which is log CT - 0.301. For example, at pH = pK1 = 6.35, the concentrations of H2CO3* and HCO3- are equal to one another and to CT/2. Likewise, at pH = pK2 = 10.33, the concentrations of HCO3- and CO32- are equal to one another and to CT/2. The points where species concentrations are equal are called cross-over points. At pH < pK1 = 6.35, H2CO3* accounts for more than 99% of CT, so the concentration of H2CO3* plots as a horizontal line with a Y-intercept of log CT. As pH nears pK1, the line must bend down to intersect the HCO3- line at the first cross-over point. The HCO3- line extends from the first cross-over point towards lower pH with a slope of +1. At pK1 < pH < pK2, HCO3- accounts for the bulk of CT, so its concentration now plots as a horizontal line. In this pH range, the H2CO3* line descends away from the cross-over point towards higher pH with a slope of -1. As pH approaches pK2, the HCO3- line drops down to the second cross-over point. At pH > pK2, CO32- is the predominant species, so its concentration now plots as a horizontal line at log CT, and the HCO3- line descends from the second cross-over point towards higher pH with a slope of -1. In the range pH > pK2, the H2CO3* line now descends towards higher pH with a slope of -2. As the CO32- line passes through the second cross-over point towards lower pH into the region where pK1 < pH < pK2, it descends with a slope of +1. When this same line crosses under the first cross-over point into the region where pH < pK1, its slope changes to +2. Although Bjerrum plots can be constructed rigorously by solving the combined mass-action and mass-balance expressions in the system for the concentrations of each of the species, there is a faster, approximate route to the construction of these diagrams. Once the total carbonate concentration (CT) is chosen and the pK values are known, the first step is to plot points with pH coordinates equal to the pK values, and concentration coordinates equal to log CT - 0.301. At pH = pK, the concentrations of two species are equal, and therefore equal to CT/2, the log of which is log CT - 0.301. For example, at pH = pK1 = 6.35, the concentrations of H2CO3* and HCO3- are equal to one another and to CT/2. Likewise, at pH = pK2 = 10.33, the concentrations of HCO3- and CO32- are equal to one another and to CT/2. The points where species concentrations are equal are called cross-over points. At pH < pK1 = 6.35, H2CO3* accounts for more than 99% of CT, so the concentration of H2CO3* plots as a horizontal line with a Y-intercept of log CT. As pH nears pK1, the line must bend down to intersect the HCO3- line at the first cross-over point. The HCO3- line extends from the first cross-over point towards lower pH with a slope of +1. At pK1 < pH < pK2, HCO3- accounts for the bulk of CT, so its concentration now plots as a horizontal line. In this pH range, the H2CO3* line descends away from the cross-over point towards higher pH with a slope of -1. As pH approaches pK2, the HCO3- line drops down to the second cross-over point. At pH > pK2, CO32- is the predominant species, so its concentration now plots as a horizontal line at log CT, and the HCO3- line descends from the second cross-over point towards higher pH with a slope of -1. In the range pH > pK2, the H2CO3* line now descends towards higher pH with a slope of -2. As the CO32- line passes through the second cross-over point towards lower pH into the region where pK1 < pH < pK2, it descends with a slope of +1. When this same line crosses under the first cross-over point into the region where pH < pK1, its slope changes to +2.
25. 25 This diagram shows a titration curve (mL acid added vs. pH) for the titration of a 5?10-3 molal Na2CO3 solution. The titration curve for a natural water containing carbonate as the only significant base would look similar. Superimposed on the titration curve is a Bjerrum diagram for the carbonate system with CT = 5?10-3 molal. The titration curve starts at point A, where almost all the carbonate is in the form of CO32-. The flat portions of the titration curve, where pH changes rapidly for small changes in added acid are the endpoints. Point B is the endpoint where essentially all CO32- present has been titrated to HCO3-, and point D is the endpoint where essentially all HCO3- has been titrated to H2CO3*. In between the two endpoints is the carbonate buffering region (point C). Note that, in this region, large additions of acid are required to change the pH; in other words, the system strongly resists pH change (the system is well buffered). In contrast, at the endpoints B and D, the system is very poorly buffered. The alkalinity is defined as the total number of equivalents of acid per liter required to bring the system from point A, to the bicarbonate endpoint (D). There is also a quantity called the p-alkalinity, which is the total number of equivalents of acid per liter required to bring the system from point A, to the carbonate endpoint (B). Note that, not all systems will have a pH such that the titration begins at point A. In fact, most natural systems will have a pH substantially lower than that at point A. Many natural waters may have essentially no p-alkalinity at all (i.e., their initial pH falls below that at point B. Some natural waters, particularly those impacted by acid-mine drainage, may have zero or negative alkalinity. This occurs when the pH of the water is lower than the pH at the bicarbonate endpoint (D). This means that the solution contains no strong bases, but contains excess strong acid. This diagram shows a titration curve (mL acid added vs. pH) for the titration of a 5?10-3 molal Na2CO3 solution. The titration curve for a natural water containing carbonate as the only significant base would look similar. Superimposed on the titration curve is a Bjerrum diagram for the carbonate system with CT = 5?10-3 molal. The titration curve starts at point A, where almost all the carbonate is in the form of CO32-. The flat portions of the titration curve, where pH changes rapidly for small changes in added acid are the endpoints. Point B is the endpoint where essentially all CO32- present has been titrated to HCO3-, and point D is the endpoint where essentially all HCO3- has been titrated to H2CO3*. In between the two endpoints is the carbonate buffering region (point C). Note that, in this region, large additions of acid are required to change the pH; in other words, the system strongly resists pH change (the system is well buffered). In contrast, at the endpoints B and D, the system is very poorly buffered. The alkalinity is defined as the total number of equivalents of acid per liter required to bring the system from point A, to the bicarbonate endpoint (D). There is also a quantity called the p-alkalinity, which is the total number of equivalents of acid per liter required to bring the system from point A, to the carbonate endpoint (B). Note that, not all systems will have a pH such that the titration begins at point A. In fact, most natural systems will have a pH substantially lower than that at point A. Many natural waters may have essentially no p-alkalinity at all (i.e., their initial pH falls below that at point B. Some natural waters, particularly those impacted by acid-mine drainage, may have zero or negative alkalinity. This occurs when the pH of the water is lower than the pH at the bicarbonate endpoint (D). This means that the solution contains no strong bases, but contains excess strong acid.
26. 26 In slide 8 we saw that, in the pH range of most natural waters, bicarbonate was the predominant species in the CO2-H2O system. In this slide, we see that the predominant species in the H2S-H2O system over the pH range of most natural waters is H2S0 (pH < 7.0) or HS- (pH > 7.0). This diagram can be constructed in exactly the same way as outlined for the previous diagram. Note that, as expected, the positions of the lines representing the concentrations of H+ and OH- have not changed.
In slide 8 we saw that, in the pH range of most natural waters, bicarbonate was the predominant species in the CO2-H2O system. In this slide, we see that the predominant species in the H2S-H2O system over the pH range of most natural waters is H2S0 (pH < 7.0) or HS- (pH > 7.0). This diagram can be constructed in exactly the same way as outlined for the previous diagram. Note that, as expected, the positions of the lines representing the concentrations of H+ and OH- have not changed.
27. 27 Bjerrum plot: full solution Closed system, with total carbonate concentration (K1, K2 known)
CT= [H2CO3]+[HCO3-] + [CO32-] (1)
K1=[H+][HCO3-]/[H2CO3] (2)
K2 =[H+][CO32-]/[HCO32-] (3)
Solution:
[CO32-] = CT/aH
[HCO3-]=CT[H+]/K2aH
[H2CO3]=CT[H+]2/K1K2aH
where: aH = (1 + [H+]/K2 +[H+]2/K1K2)
28. 28 SPECIATION IN OPEN CO2-H2O SYSTEMS In an open system, the system is in contact with its surroundings and components such as CO2 can migrate in and out of the system. Therefore, the total carbonate concentration (CT) is not constant.
In an open system, the solubility of CO2 increases dramatically with pH, once pH has increased beyond pK1
At low pH, the solubility of CO2 is independent of pH.
Let us consider two natural waters
open to the atmosphere, for which pCO2 = 10-3.5 atm.
open to local exchange, for which pCO2 = 10-2.0 atm. Many natural waters are actually closer to being open systems with respect to CO2, including, according to Kehew (2001), many ground waters. In an open system, CO2 is free to pass into or out of the system. Thus, there is no guarantee that the total inorganic carbon concentration will remain constant. In other words, we lose our mass-balance constraint on the system. On the other hand, open systems are generally in equilibrium with a CO2-containing atmosphere, which can, over short time scales, be considered to be relatively constant. We therefore gain a Henry�s Law constraint as shown in this slide. If pCO2 is fixed, then the concentration of H2CO3* is fixed, independent of pH. However, just because the concentration of H2CO3* is fixed, this does not mean that the total carbonate concentration is fixed, because variable amounts of dissociated forms of carbonate, i.e., HCO3- and CO32- will be present depending on the pH. However, if we know the pH and the pCO2 for an open CO2-H2O system, we can calculate the concentrations of all relevant species in the system from the mass-action expressions. These mass-action expressions include the Henry�s law constraint (KCO2) shown in this slide, the dissociation constants of carbonic acid (K1, K2) and the dissociation constant of water (Kw). Many natural waters are actually closer to being open systems with respect to CO2, including, according to Kehew (2001), many ground waters. In an open system, CO2 is free to pass into or out of the system. Thus, there is no guarantee that the total inorganic carbon concentration will remain constant. In other words, we lose our mass-balance constraint on the system. On the other hand, open systems are generally in equilibrium with a CO2-containing atmosphere, which can, over short time scales, be considered to be relatively constant. We therefore gain a Henry�s Law constraint as shown in this slide. If pCO2 is fixed, then the concentration of H2CO3* is fixed, independent of pH. However, just because the concentration of H2CO3* is fixed, this does not mean that the total carbonate concentration is fixed, because variable amounts of dissociated forms of carbonate, i.e., HCO3- and CO32- will be present depending on the pH. However, if we know the pH and the pCO2 for an open CO2-H2O system, we can calculate the concentrations of all relevant species in the system from the mass-action expressions. These mass-action expressions include the Henry�s law constraint (KCO2) shown in this slide, the dissociation constants of carbonic acid (K1, K2) and the dissociation constant of water (Kw).
29. 29 The diagram in this slide is a plot of log concentration vs. pH for an open CO2-H2O system with pCO2 = 10-3.5 atm. Note that this plot yields similar information as the Bjerrum plot for closed systems. It shows us the pH ranges in which the three different carbonate species are predominant. However, this diagram also shows us the total carbonate for the system (the heavy curve), which we see changes with pH, unlike in the closed system. We see that, at pH < pK1, H2CO3* is the predominant species. Because it accounts for almost all the total carbonate in this pH range, the curve for CT is practically coincident with the line showing the concentration of H2CO3*. Moreover, because the concentration of H2CO3* is independent of pH, so is CT in this pH range. At pH = pK1, H2CO3* and HCO3- are present at equal concentrations, so the total carbonate concentration is double the concentration of either of these species. Hence, the CT curve rises 0.301 log units (= log 2) above the crossover point at pH = pK1, with carbonate ion contributing negligibly to CT at this pH. At pK1 < pH < pK2, HCO3- is the predominant species, and its concentration is therefore approximately equal to CT. Therefore, the CT curve is nearly coincident with the line for HCO3- in this pH range, and CT increases one log unit for every unit increase in pH. At pH = pK2, HCO3- and CO32- are present in equal concentrations, with H2CO3* contributing negligibly. Thus, the CT curve rises 0.301 log units above the crossover point at this pH. Finally, at pH > pK2, CO32- is the predominant species, the CT curve follows the CO32- line, and CT increases 2 log units for every unit increase in pH. The diagram in this slide is a plot of log concentration vs. pH for an open CO2-H2O system with pCO2 = 10-3.5 atm. Note that this plot yields similar information as the Bjerrum plot for closed systems. It shows us the pH ranges in which the three different carbonate species are predominant. However, this diagram also shows us the total carbonate for the system (the heavy curve), which we see changes with pH, unlike in the closed system. We see that, at pH < pK1, H2CO3* is the predominant species. Because it accounts for almost all the total carbonate in this pH range, the curve for CT is practically coincident with the line showing the concentration of H2CO3*. Moreover, because the concentration of H2CO3* is independent of pH, so is CT in this pH range. At pH = pK1, H2CO3* and HCO3- are present at equal concentrations, so the total carbonate concentration is double the concentration of either of these species. Hence, the CT curve rises 0.301 log units (= log 2) above the crossover point at pH = pK1, with carbonate ion contributing negligibly to CT at this pH. At pK1 < pH < pK2, HCO3- is the predominant species, and its concentration is therefore approximately equal to CT. Therefore, the CT curve is nearly coincident with the line for HCO3- in this pH range, and CT increases one log unit for every unit increase in pH. At pH = pK2, HCO3- and CO32- are present in equal concentrations, with H2CO3* contributing negligibly. Thus, the CT curve rises 0.301 log units above the crossover point at this pH. Finally, at pH > pK2, CO32- is the predominant species, the CT curve follows the CO32- line, and CT increases 2 log units for every unit increase in pH.
30. 30 The diagram in this slide is a plot of log concentration vs. pH for an open CO2-H2O system with pCO2 = 10-2.0 atm. Compared to the previous plot at lower partial pressure of CO2, CT is higher at every pH. However, the ranges of pH in which each species is predominant have not changed. In other words, the cross-over points are exactly the same; they are independent of pCO2. In effect, the CT curve and the lines for each of the carbonate species have shifted upward by 1.5 log units, but their horizontal positions have not changed. Note also that, as expected, the positions of the lines representing the concentrations of H+ and OH- have not changed.
The figures in this slide and the previous one illustrate that, in an open system, the solubility of CO2 increases dramatically with pH, once pH has increased beyond pK1. At low pH, CO2 solubility is independent of pH. These diagrams explain why it is unwise to leave concentrated base solutions, such as NaOH or KOH, exposed to the atmosphere. Such solutions will absorb large quantities of CO2 over time, which will neutralize some of the OH- in the solution, changing its concentration, and add carbonate impurities.
We are now in a position to add another dimension to the system. In our next lecture, we will discuss equilibria involving CO2, H2O and carbonate minerals such as calcite and dolomite. The diagram in this slide is a plot of log concentration vs. pH for an open CO2-H2O system with pCO2 = 10-2.0 atm. Compared to the previous plot at lower partial pressure of CO2, CT is higher at every pH. However, the ranges of pH in which each species is predominant have not changed. In other words, the cross-over points are exactly the same; they are independent of pCO2. In effect, the CT curve and the lines for each of the carbonate species have shifted upward by 1.5 log units, but their horizontal positions have not changed. Note also that, as expected, the positions of the lines representing the concentrations of H+ and OH- have not changed.
The figures in this slide and the previous one illustrate that, in an open system, the solubility of CO2 increases dramatically with pH, once pH has increased beyond pK1. At low pH, CO2 solubility is independent of pH. These diagrams explain why it is unwise to leave concentrated base solutions, such as NaOH or KOH, exposed to the atmosphere. Such solutions will absorb large quantities of CO2 over time, which will neutralize some of the OH- in the solution, changing its concentration, and add carbonate impurities.
We are now in a position to add another dimension to the system. In our next lecture, we will discuss equilibria involving CO2, H2O and carbonate minerals such as calcite and dolomite.
31. 31 SOURCES OF CO2 IN NATURAL WATERS When we determine pCO2 in natural waters, particularly ground waters and soil solutions, values greater than atmospheric are commonly obtained.
System essentially closed to atmospheric CO2 (little exchange)
Respiration by plant roots and microbes consumes organic matter and produces CO2:
CH2O + O2 ? CO2 + H2O
Amount of CO2 production depends on temperature, soil moisture content, and the amount of organic matter. When we apply the equation in slide 3 to chemical analyses of ground waters and soil solutions, we often calculate pCO2 > 10-3.5 atm, or in other words, values greater than we would expect for equilibrium with the Earth�s atmosphere. Why are these pCO2 values so different? Clearly, these systems must be closed to atmospheric CO2; CO2 is not free to escape or be buffered by the atmosphere, so something else is controlling its partial pressure. The process that produces additional CO2 is the decomposition of organic matter, primary through the respiration of plant roots and microbes.
A schematic reaction for the process is given in this slide, using formaldehyde (CH2O) as a proxy for the organic matter. Commonly, simple organic molecules such as formaldehyde are employed to illustrate the general trends expected in reactions involving organic matter. The actual organic matter present in a soil or aquifer will, of course, be more complex and probably have a slightly different overall chemical composition. However, this does not change the fact that oxidation of such organic matter leads to the production of CO2, and if the system is not open to the atmosphere, the partial pressure of CO2 can build up to values much higher than atmospheric.
Many factors control the amount of CO2 produced, including temperature, the humidity of the soil, and the composition and amount of organic matter. These are all reflections of the particular climate in the area of interest. When we apply the equation in slide 3 to chemical analyses of ground waters and soil solutions, we often calculate pCO2 > 10-3.5 atm, or in other words, values greater than we would expect for equilibrium with the Earth�s atmosphere. Why are these pCO2 values so different? Clearly, these systems must be closed to atmospheric CO2; CO2 is not free to escape or be buffered by the atmosphere, so something else is controlling its partial pressure. The process that produces additional CO2 is the decomposition of organic matter, primary through the respiration of plant roots and microbes.
A schematic reaction for the process is given in this slide, using formaldehyde (CH2O) as a proxy for the organic matter. Commonly, simple organic molecules such as formaldehyde are employed to illustrate the general trends expected in reactions involving organic matter. The actual organic matter present in a soil or aquifer will, of course, be more complex and probably have a slightly different overall chemical composition. However, this does not change the fact that oxidation of such organic matter leads to the production of CO2, and if the system is not open to the atmosphere, the partial pressure of CO2 can build up to values much higher than atmospheric.
Many factors control the amount of CO2 produced, including temperature, the humidity of the soil, and the composition and amount of organic matter. These are all reflections of the particular climate in the area of interest.
32. 32 Reactions Affecting CO2 and pH Key:
Blue results in pH increase (more alkaline)
Red results in pH decrease (more acidic)
CO2(g) dissolution, CO2 (aq) exsolution
CO2(g) + H2O ? H2CO3�
Photosynthesis, Respiration & aerobic decay
CO2(g) + H2O ? 1/6C6H12O6 (aq) + O2
Methane fermentation (anaerobic decay)
C6H12O6 (aq) + O2 ? CH4 + H2O + CO2
Nitrate uptake and reduction
NO3- + 2H+ + 2CH2O ? NH4+ + 2CO2 + H2O
33. 33 Reactions Controlling CO2 and pH Carbonate mineral Dissolution or precipitation
CaCO3 (calcite ) + H+ ? Ca2+ + H2O+ CO2
Sulfate reduction
2CH2O + SO42- + H+ ? HS- + 2H2O + 2CO2
Denitrification
5CH2O + 4NO3- + 4H+ ? 2N2 + 5CO2 + 7H2O
Chemical weathering of Al-silicate weathering
KAlSi3O8 + 2CO2 + 11H2O ? Al2Si2O5(OH)4 + 2K+ + 2 HCO3-
34. 34 CO2 in Natural Settings Time of day
Higher pCO2 values occur in surface waters at night because of respiration and aerobic decay and groundwater inflow.
Lower pCO2 values occur in surface waters during the day because of photosynthesis.
Time of year
Soil pCO2 values are highest during the growing season because of plant respiration.
Consequently, shallow groundwaters will have their highest pCO2 values during the growing season.
35. 35 Compute the pH of an aqueous system Step 1: List species in solution
Step 2: Identify how concentrations of the species depend on each other
Step 3: Establish the mass balance
Step 4: Establish the charge balance
36. 36 Example: HAC in water CH3COOH ? CH3COO- + H+ Ka = 10-4.75
Species: CH3COOH, CH3COO- , H+, OH-
Mass balance: CT = [HAc] + [Ac-]
Charge balance: [H+] = [OH-] + [Ac-]
Ka =[Ac-][H+]/[HAc]=10-4.75
Kw=[H+][OH-] = 10-14
With given CT (concentration of HAC you made), we have four equations, four unknowns, we can compute [H+] hence pH
37. 37 pH of the sea pH of the sea can be computed following the above procedures
Basically, pH of the sea is controlled by the carbonate species
The actual computation is more complicated and beyond this class