Remote Sensing – Fire Weather Product Presentation
360 likes | 546 Views
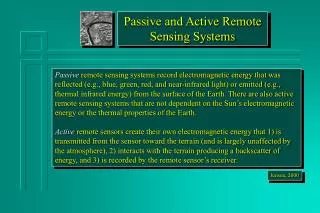
Remote Sensing – Fire Weather Product Presentation. By Brian Hays & Kyle Zahn. Overview. Introduction to Burned Area Reflectance Classification (BARC) Satellites and Sensors Used in BARC BARC Products Case Study Verification of BARC References Questions?. History of BARC.

Remote Sensing – Fire Weather Product Presentation
E N D
Presentation Transcript
Remote Sensing – Fire Weather Product Presentation By Brian Hays & Kyle Zahn
Overview • Introduction to Burned Area Reflectance Classification (BARC) • Satellites and Sensors Used in BARC • BARC Products • Case Study Verification of BARC • References • Questions?
History of BARC • Traditionally, burn severity maps drawn up by hand from observations from helicopters • In 1996, RSAC developed an airborne color infrared camera to develop the maps • BARC started in 2001 as a pilot project to overcome the logistical difficulties involved with the previous methods
Satellites • Information is primarily gathered from the Landsat system, which contains the thematic mapper • Additional information is gathered from the Terra system, utilizing the ASTER and MODIS sensors • Though expensive, information is also gathered from the SPOT 4 system
Sensor Names Decoded • MODIS – Moderate Resolution Imaging Spectroradiometer • ASTER - Advanced Spaceborne Thermal Emission and Reflection Radiometer • MASTER – M(ODIS)ASTER – airborne simulator for the MODIS and ASTER sensors
Sensors • MODIS • Uses 31 bands ranging from .5 to 2 microns • Global coverage on a very short time scale • Coarse resolution
Sensors • ASTER • Uses three types of scanners. • SWIR – Shortwave Infrared • TIR – Thermal Infrared • VNIR – Visible and Near Infrared
Sensors Source : Field Validation of Burned Area Reflectance Classification (BARC) for Post Fire Assessment, USDA Forest Service 2004
Computing the Values Normalized Burned Ratio – NBR NBR = (NIR – SWIR)/(NIR + SWIR) Delta Normalized Burned Ratio – dNBR dNBR = [NBR(pre-burn) – NBR(post-burn)] Normalized Difference Vegetation Index – NDVI NDVI = (NIR – RED)/(NIR + RED)
Value Meanings • The NBR is a measure of the difference between the reflected shortwave radiation from healthy vegetation and the emitted longwave radiation from charred vegetation • The higher the amount of emitted longwave radiation, the more severe the burn damage
Value Meanings • dNBR is a comparative measurement between the pre-fire spectral data and the postfire data • It is not available for all fires due to pre-fire coverage restraints • In theory, the dNBR should yield better information about the burn severity of a given area
BARC Levels • BARC products come in two flavors • The basic BARC product is a four level scale including healthy, slight, moderate, and severe • The Adjustable BARC comes in a 256-bit format such that the BAER teams can create their own thresholds
Case Study Introduction • Groups Involved • USDA Forest Service Remote Sensing Applications Center (RSAC) • Burned Area Emergency Rehabilitation (BAER) Teams • USGS EROS Data Center (EDC) • Products Involved • Burned Area Reflectance Classification (BARC) & BARC-A (Adjustable) • Normalized Burned Ratio (NBR) • Delta Normalized Burned Ratio (dNBR) • Normalized Difference Vegetation Index (NDVI)
Case Study Introduction • Case Study of six 2003 wildfires in Western Montana and southern California. • The main objective of the paper was to asses burned severity remotely and on the ground and compare them • For this they would use locations on the ground to provide ground truth to compare to satellite observations
Case Study Introduction • Sensors Used • Default Imagery • Landsat-TM • Secondary Imagery • SPOT 4 • ASTER • MASTER • MODIS
Case Study Introduction • Landsat-TM is the preferred sensor due to its desired temporal, spatial, and spectral characteristics • SPOT XI is also desirable system because it is pointable • However, its use is limited as SPOT XI is much more expensive then Landsat-TM to use. • The other satellite systems have much coarser imagery then either of these two systems
Case Study Introduction • Fire Locations
Case Study Data • BARC Maps of the Six Fires
Case Study Analysis • Analysis • Calculated Spectral Indices were divided into: • NBR • dNBR • NDVI • dNBR derived BARC • dNBR derived BARC-A • Measured and derived field variables were divided into four categories: • Overstory • Understory • Surface Cover • Soil Infiltration
Case Study Analysis • Analysis (cont.) • Correlation matrices between field and image variables were generated in R. Pearson correlation statistics • Correlation values greater then 0.5 were considered meaningful • These were tallied within field and spectral categories already mentioned as well as by sensor type and strength of correlation
Case Study Results • Results • Correlations • Overstory and Understory produced the highest amount of meaningful correlations with the spectral data(>0.5) • Surface cover variables were lower • Soil Infiltration was the lowest • Instruments • ASTER sensor produced the best correlations followed closely by the MASTER sensor • Only available at Old and Simi Fires • LANDSAT-TM and SPOT 4 were intermediate • MODIS produced the worst results
Case Study Results • Results (cont.) • Indices • NBR and dNBR produced much better correlations then NDVI • dNBR did better then NBR in general except in overstory and surface cover categories • NBR correlates better with field attributes when the satellites capture post-fire effects immediately • dNBR correlated better with field attributes when satellites capture post-fire effects after a few weeks • Fires • Cooney Ridge produced the best correlations followed by the other Montana Fires • Southern California fires produced the worst results • Lack of tree overstory at many of the California sites likely accounts for the difference
Case Study Results • Temporal Fire Effects • Some of the lower correlations can be explained by the temporal nature of the data being collected. • Ash cover for example had a very low correlation rate, however, it is quickly removed from the area by wind and water after a fire • Additionally green vegetation regrowth and new litter are also dynamic and depend upon the specific situation • Temporal Correlations • Specifically these effects can be applied to the two Montana fires • Here satellite data was acquired very soon after the fire and ground sites were also set up quickly. • These reasons may explain why these two fires had the highest correlation values
Case Study Conclusions • Conclusions • Results indicate that BARC maps should be considered more indicative of vegetation severity then soil severity • This makes sense since vegetation occludes the soil • Spectral mixture analysis is one way to better observe and estimate the green and nonphotosynthetic vegetation and litter and soil fractions directly from the imagery • The large amount of field data will serve as valuable ground truth to determine what effect the vegetation variables have on moderate and especially low burn severities as opposed to high burn severities
References • http://masterweb.jpl.nasa.gov/ • http://terra.nasa.gov/ • http://www.spot-vegetation.com/vegetationprogramme/Pages/TheVegetationProgramme/spot4.html • http://landsat.gsfc.nasa.gov/ • http://modis.gsfc.nasa.gov/ • http://asterweb.jpl.nasa.gov/ • http://modis-sr.ltdri.org/MAIN_RATIONALE/Introduction/sc2-modis%255B1%255D.gif&imgrefurl=http://modis-sr.ltdri.org/MAIN_RATIONALE/WELCOME_MAIN.html • Hudak, A., Robichaud, P., Jain, T., Morgan, P., Carter, S., Clark, J. “The Relationship of Field Burn Severity Measures to Satellite-Derived Burned Area Reflectance Classification (BARC) Maps” • Hudak, A., Robichaud, P., Evans, J., Clark, J., Lannom, K., Morgan, P. “Field Validation of Burned Area Reflectance Classification (BARC) Products for Post Fire Assessment”