NORSAR Seismic Modelling: State-of-the-Art Software for Seismic Research & Exploration
510 likes | 568 Views
Explore NORSAR's cutting-edge seismic modelling software including NORSAR-2D, NORSAR-3D, VelRock, and HybriSeis for advanced seismic analysis and simulation in research and commercial projects.

NORSAR Seismic Modelling: State-of-the-Art Software for Seismic Research & Exploration
E N D
Presentation Transcript
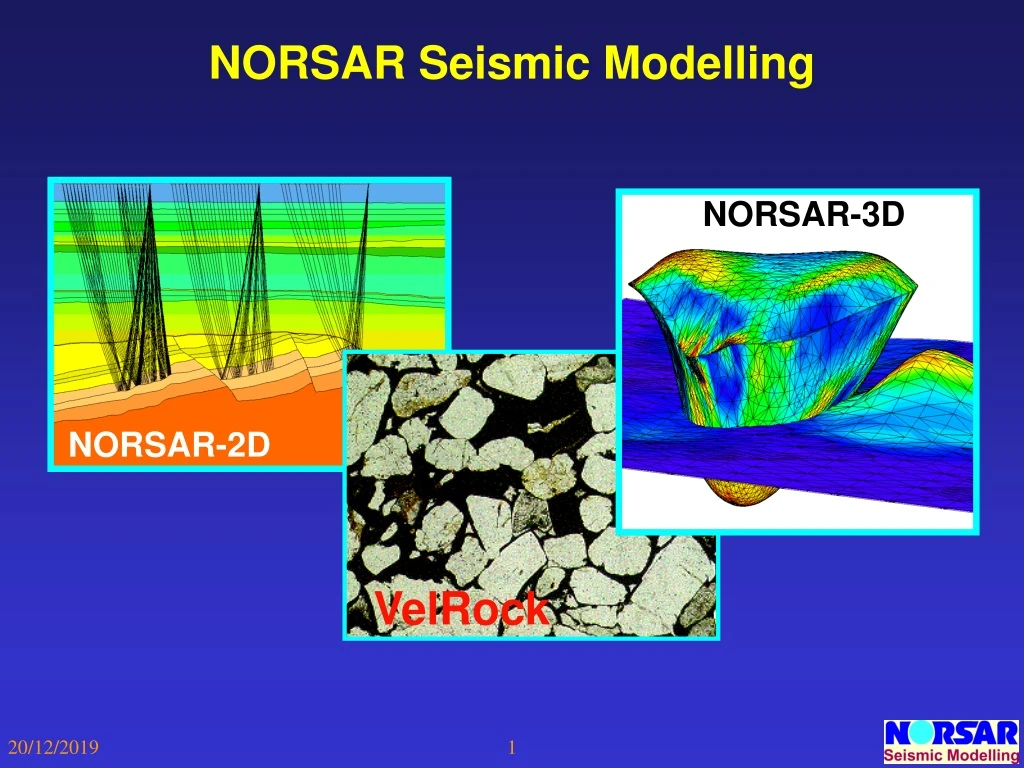
NORSAR Seismic Modelling NORSAR-3D NORSAR-2D VelRock
NORSAR vs. UiB • Agreement on cooperation between NORSAR and the University of Bergen. • NORSAR was providing Institute of Solid Earth Physics with software for use in research projects, theses and education, • includes commercial tools such as NORSAR-2D, NORSAR-3D, VelRock, HybriSeis, and • prototype software for special studies. • NORSAR is willing to extend this to include the newly formed Department of Earth Science and the CIPR.
NORSAR-2D: Ray Modelling • Two-point tracing • Interactive • Robust • User-friendly
NORSAR-3D: Ray Modelling • Wavefront Construction (*) • Open models • Fits for PSDM • Network of computers (*) NORSAR is the developer of Wavefront Construction!
NORSAR-3D: Illumination • Various Maps • Simulated Migration Amplitudes • Projects • On-going research
Rock Physics Modelling Analysing and predicting how different reservoirproperties of porous rocks affect the seismic properties. VP = 2.6 km/s VS = 1.4 km/s = 2.2 g/cm3 Rock Physics VP: P-velocity VS: S-velocity lithology fluids porosity permeability
VelRock and N2D/N3D VelRock rock models can be used in N2D/N3D
Ray methods (standard software) 2D/3D Normal incidence ray tracing (zero offset unmigrated) 2D/3D Image ray tracing (zero offset migrated) 2D/3D Common shot (offset HSP/ VSP/OBC) 2D/3D Green’s functions 2D Anisotropic Ray Mapping Special methods (internal software) 1D Reflectivity (offset) 2D/3D Eikonal Method 2D Finite Difference 2D/3D Migrated Amplitudes 2D/3D HybriSeis Seismic Wave Simulation Tools
Typical tasks Model based analysis of well log data. Model based analysis of velocities measured on cores. Structural and velocity macromodel building. Geophysical reservoir model building. Modelling of seismic responses. Model based processing and analysis of seismic data. Special tasks Time-lapse feasibility studies. AVO modelling. Survey planning. Identification of multiples and peg-legs. Greens functions for PSDM. Amplitude and illumination maps. Reflector-oriented amplitude recovery (ROAR). Applications of NORSAR Software
NORSAR-3D NORSAR-3D:Structural and Velocity Model Building3D Wavefront construction
Possible Input Data • Interpreted horizons (time, depth). • Pre-calculated interval velocities (const., grid, cube). • Stacking velocities, migration velocities. • Checkshots. • Well log data (P-velocity, S-velocity, density). • Petromarkers.
Shot Receivers Salt diapir Targets (gas pockets) Example: Undershooting of Salt Dome
Raypaths Ray Paths and Reflection Points Number of arrivals/receiver Reflection Points
Wavefronts Raypaths Wavefront Construction
Bulk Modelling • Depth model built from depth grids and velocity grids. • Ray modelling done by wavefront construction. • 4011 shots simulated in parallel on 10 workstations in a few hours. • A total of about 24 million events for PP reflections from the target horizon (Top Reservoir) was found.
{Event counts}/{nominal fold(30)} Illumination Density Map
Real Model Example The example to follow was presented by Børge Rosland (Seispro) and Geir Drivenes (Enterprise Oil) in the paper“Large Scale 3D Seismic Modelling in Exploration”,paper no. C-42, EAGE meeting, Glasgow, 2000.
The first 5 reflectors are relatively flat. The BCU reflector and pre-BCU reflectors are complex. The P-velocity is shown on the left. Geometry Model
Target Horizon Every 2nd shot lines Receivers Model and Marine Survey
Modelled shot records, ~ 40 million traces. P-P reflection data from two reflectors: one smooth Cretaceous reflector. one complex pre-BCU reflector. Bulk Modelling Single Shot Footprint Pre-BCU Reflector
Highly-curved parts of the reflector are strongly illuminated Illumination Density Map About 25 000 000 reflected rays Illumination Density Map: Number of reflection points in bin cells (50x25m) on the target horizon
Migrated Modelled Data Reflection Amplitude Migrated Seismic Data Reflection Amplitude Real vs Modelled Amplitudes
Normal Incidence Reflection Coefficient Migrated Modelled Data Reflection Amplitude Modelled Amplitudes
Integrated Modelling Based Reservoir Analysis NORSAR tools for rock physics and advanced seismic wave simulation
Gullfaks Time Lapse Data -1985 and 1996 OWC Top Res. OWC Top Res. Courtesy of Statoil
Seismic data Well log data Fluid simulations Lab. data Geological model Mineralogy Integrated rock physics and seismic modelling Seismic response Integrated Rock Physics and Seismic Modelling
Rock Physics Models Analysing and predicting how different reservoir properties of porous rocks influence on the seismic properties. VP = 2.6 km/s VS = 1.4 km/s = 2.2 g/cm3 Rock Physics VP: P-velocity VS: S-velocity lithology fluids porosity permeability
Factors Influencing on Seismic Velocities brine shaley sand oil velocity velocity velocity gas sand shale pore fluid porosity lithology velocity velocity velocity pore pressure confining pressure effective pressure T 3 T velocity velocity velocity 2 T 1 age / depth temperature cementation
Seismic Response of Reservoir Properties • Rock physics is the key for understanding how geological properties are manifested in seismic observations, through bright spots, AVO characteristics etc. • Rock physics modelling allows for predicting seismic rock properties at other physical conditions than observed in wells or by laboratory measurements. • Improved understanding about how rock properties influence on seismic properties and seismic response is vital to the feasibility of seismic monitoring of hydrocarbon reservoirs. • Integrated rock physics and seismic modelling provide physically consistent tools for identifying and quantifying the important reservoir properties and predict their sensitivity to changes.
rfl=1.0 rfl=1.0 Multi-well Log Data Sorting and Quality Control
Rock Model Calibration Rock model variables: Porosity, Lithology, Pore fluid.
Model Based Analysis of Well Log Data • Use calibrated rock physics models for processing well log data, and predicting log properties. • Possible to combine with AVO analysis of modelled effects. Types of analyses: • Prediction of S-wave velocity. • Prediction of impedances, elastic moduli etc. • Prediction of geophysical properties assuming other saturating fluids (fluid substitution). • Corrections for drilling mud invasion. • Lithology and fluid sensitivity analysis. • Property cross-plotting analyses (QC and diagnosis). • Pressure effect sensitivity analysis (using core measurements). • Integration of fluid simulation results. • Upscaling and homogenization.
Log data Rock model Castagna Prediction of S-wave Velocity Logs
Integration with Fluid Simulations T0 T1 Sgas Sgas DvP DZP DSg
0.25 km/s 0.1 g/cm3 Rock Physics Modelling of Fluid Effects
AVO Modelling of Fluid Effects Brine Saturated Gas Saturated
Reservoir properties and amplitude variations Lateral change in fluid composition and shale contents. Modelled seismic response from NIP tracer
Effect of Offset, Lithology and Saturating Fluid Homogeneous reservoir properties Vertical trend in lithology GOC GOC Zero Offset Section OWC 2km Offset Section
Gullfaks 2D Reservoir Models Scenario 1 : SOil=0.9 Scenario 2 : SOil=0.2 HybriSeis PSDM All offsets
Seismic data Inversion Seismic modelling Geological model Rock physics Fluid flow simulations Schematic View of a Time-lapse Modelling Loop