Balancing Water: Sources, Usage, and Development Projects
510 likes | 607 Views
Explore the significance of water sources worldwide, escalating water use trends, and impact of water development projects on ecosystems. Learn about the challenges and solutions in managing water sustainably.

Balancing Water: Sources, Usage, and Development Projects
E N D
Presentation Transcript
Topic 5 – Hydroelectricity and Nuclear Energy A – Water B – Hydroelectricity C – Nuclear Energy
A. Water Sources of Water Water Use Water Development Projects
1. Sources of Water • Rivers, lakes, and streams • Traditional sources of water. • 20% of the world’s reserves in the Great Lakes basin. • 50% of all major rivers are polluted and overused. • 700 million Chinese are drinking contaminated water. • Aquifers • Important water sources, especially in many dry areas. • Wells of various kinds tap into the water table to draw upon underground sources of water. • 51% of all the drinking water in the US. • Many aquifers are re-charged: • Receive water through percolation of rainwater through the overlying soil and rock structure.
1. Sources of Water • Fossil aquifers • They lie under arid regions today. • Formed in earlier geologic periods when the region may have received greater precipitation. • Not being re-charged: a non-renewable resource. • The aquifer underlying parts of Saudi Arabia falls into this category. • De-salinization of sea water • Remains an expensive alternative. • Not produced satisfactory results in many areas, at least as far as human consumption is concerned. • Technologies for de-salinization are receiving greater priority. • Moving from steam-process to filtration (osmosis). • Pushed the price for desalted seawater down to $2 for a thousand gallons, compared with $6 around 1990.
2. Water Use • Water use • Tripled since 1950. • Water use is increasing at a pace faster than population. • Linked with rising living standards. • Roles • Water has two primary contradictory roles: • Key life support for all species and natural communities. • A commodity to be sold and used for agricultural, industrial, and urban purposes. • The overuse of water and the pollution, if allowed to proceed unchecked, render the first role unsustainable.
2. Global Water Withdrawal by Sector, 1900-2000 (in cubic km)
2. Water Use • Agriculture • Linked with population growth. • Expansion of the land under cultivation. • Irrigation necessary to render arable otherwise marginal land. • Industrial • Used by heavy industry, notably mining. • Industrialization is leading to rapid increases in water use. • Municipal • Direct human consumption of water. • Highly concentrated geographically due to urbanization. • A human being needs 3-5 liters of water per day.
2. Percentage of Land Irrigated Irrigated Area, Top 10 Countries, 1995 (in millions of hectares)
2. Water Use • Water losses • Loss of water before it can be used. • Result of human activity and/or alteration of the environment. • Such losses amount to just 5% of water use. • Evaporation of still water from reservoirs. • Inefficient irrigation practices. • Infrastructure decay: • Urban plumbing and sewer systems. • Problematic in many developing countries that cannot afford better upkeep. • Water pollution: • 20% of rivers in China are severely polluted. • 80% cannot sustain commercial fishing.
3. Water Development Projects • River diversion • Re-channeling water in some areas to render it more readily available for use, especially in agriculture. • Reduces water flow to downstream locations. • Sometimes, international boundaries are crossed by rivers. • Removal of water for purposes upstream means that less water is available in the country (or countries) that lies downstream. • Rivers no longer reaching the sea • The Nile in Egypt. • The Ganges in South Asia. • The Yellow River in China. • The Colorado River in North America.
3. Water Development Projects • The Nile • The construction of the Aswan High Dam in southern Egypt. • Interrupted the seasonal pattern of flooding along the Nile Valley. • These floods throughout history have served to replenish the soils of the valley. • The soils are now not receiving the necessary nutrients and may be depleted. • Usage of fertilizers instead. • Irrigation water from the dam also enabled Egypt to double agricultural production. • Created increased soil salinity in the process. Aswan High Dam
3. Water Development Projects • Colorado River • Covers 7 states; a population of 25 million. • No longer a river; a series of lakes. • Competition between urban and agricultural use. • Competition between cities: • Los Angeles, Phoenix and Las Vegas. • Fast growing region: • Las Vegas is the fastest growing city of the United States. • All the water is used before it reaches the Gulf of California: • 1993 was the last time water flowed in the Gulf.
3. Water Profile of the Colorado River Evaporation from lake Powell Evaporationfrom lake Mead Diversion toLos Angeles andPhoenix Usage by the Imperial Valley Green River Grand Junction Gulf of California
3. Flow of Colorado River Below All Major Dams and Diversions, 1905-92
B. Hydropower Hydropower Generation Hydropower Developments Tidal Power
1. Hydropower Generation • Nature • Generation of mechanical energy using the flow of water as the energy source. • Gravity as source and sun as the “pump”. • Requires a large reservoir of water (energy “storage”). • 95% energy efficiency. • Considered cleaner, less polluting than fossil fuels. • Cheapest source of energy: 1 cent per kWh. • Utilization • Water wheels used for centuries (grinding flour). • Used during the industrial revolution to power the first machines. • First hydroelectric plant; Niagara Falls (1879).
1. Hydropower Generation Sun Evaporation Water Sufficient and regular precipitations Precipitation Rivers Flow Reservoirs Suitable local site Accumulation Dam Gravity Turbine Power loss due to distance Electricity
1. World Hydroelectric Generating Capacity, 1965-2009 (in megawatts)
1. Hydropower Generation • Controversy • Require the development of vast amounts of infrastructures: • Dams. • Reservoirs. • Power plants and power lines. • Very expensive and consume financial resources or aid resources that could be utilized for other things. • Environmental problems: • The dams themselves often alter the environment in the areas where they are located. • Changing the nature of rivers, creating lakes that fill former valleys and canyons, etc.
2. Hydropower Developments • Dam construction • Assisted tremendously in achieving the increases registered in irrigation worldwide. • Reaching the point where further increases will be difficult to realize. • Relatively few remaining rivers and streams. • More than 45,000 dams have been constructed worldwide. • The rate of construction has declined recently. • China is the most active.
2. Hydropower Developments • Problems with dams • Exceptionally expensive to build: • Large dams cost billions of dollars. • Displace many people in areas to be flooded by the reservoir that is created behind the dam. • The reservoir takes some land out of production. • Dredging: • The outcome of siltation. • The volume of sediments deposited from upstream by the river that is dammed can outstrip the capacity to dredge. • The reservoir may eventually fill in and the dam will become useless. • The rate of sedimentation increases with population growth and the expansion of agriculture in the upstream locations. • The flood control achieved by the dam is helpful in some ways.
3. Tidal Power • Tidal power • Gravitational effect of the earth / moon rotation: • Energy “pulled” from deceleration of the earth’s rotation speed. • From 21.9 hours 600 million years ago to 24 hours today. • Takes advantage of the variations between high and low tides: • Tidal stream: turbine extracting energy (like a windmill); low environmental impacts. • Tidal barrage: dam across a tidal estuary; capital intensive and significant environmental impacts. • First tidal power station; 1966 in France (remains the world’s largest). • Tidal stream offers good potential.
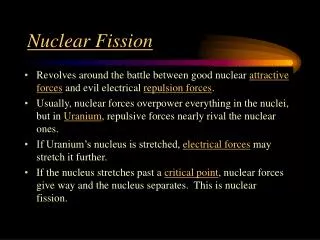
C. Nuclear Power Nuclear Power Generation Nuclear Waste Disposal
1. Nuclear Power Generation • Nature • Fission of uranium to produce energy. • The fission of 1 kg (2.2 lbs.) of uranium-235 releases 18.7 million kilowatt-hours as heat. • A nuclear power plant of 1,000 megawatts requires 200 tons of uranium per year. • Heat is used to boil water and activate steam turbines. • Uranium is fairly abundant. • Requires massive amounts of water for cooling the reactor. • Relatively cheap: 2 cents per kWh (4 cents for coal).
1. Nuclear Power Generation Production and storage Suitable site (NIMBY) Large quantities Uranium Water Reactor Fission Waste storage and disposal Steam Turbine Electricity
1. Nuclear Power Generation • Nuclear power plants • 436 operating nuclear power plants (civilian) worldwide. • Very few new plants coming on line: • Public resistance (NIMBY syndrome). • High costs. • Nuclear waste disposal. • 30 countries generate nuclear electricity: • About 15% of all electricity generated worldwide. • Required about 77,000 metric tons of uranium. • United States: • 104 licensed nuclear power plants; about 20% of the electricity. • Licenses are usually given for a 40 year period. • Many US plants will are coming up for 20 years license extensions. • No new nuclear power plant built since 1979 (Three Mile Island incident). • 4-6 new units by 2018. • China: • 11 nuclear power plants. • Plans to add 13 new nuclear reactors per year until 2020.
1. Life Cycle of a Nuclear Power Plant Planning, Infrastructure
1. New Nuclear Power Reactors Designs PWR: Pressurized water reactor. BWR: Boiling water reactor. LWR: Light water reactor.
1. Nuclear Power Generation • Uranium reserves • Canada and Australia account for 43% of global reserves. • The problem of “peak uranium”. • 20 years of reserves in current mines. • 80 years of known economic reserves.
1. Nuclear Power Generation • Reliance • Some countries have progressed much further in their use of nuclear power than the US. • High reliance: • France, Sweden, Belgium, and Russia have a high reliance on nuclear energy. • France has done this so as not to rely on foreign oil sources. • It generates 75% of its electricity using nuclear energy. • The need to import most fossil fuels provides an extra impetus to turn to nuclear energy. • Phasing out: • Nuclear energy perceived as financially unsound and risky. • No new nuclear power plant built in Europe since Chernobyl (1986). • The German parliament decided in 2001 to phase out nuclear energy altogether.
2. Nuclear Waste Disposal • Nuclear waste • Nuclear fuel is made of solid pellets of enriched uranium. • One pellet has an amount of energy equivalent to almost one ton of coal. • Fuel will be used until it is spent, or no longer efficient in generating heat. • Once a year, approximately one-third of the nuclear fuel inside a reactor is removed and replaced with fresh fuel. • Temporarily put into a pool of water at the reactor site. • Water is a radiation shield and coolant. • Need to find safe, permanent disposal is becoming critical. • At some nuclear power plants, the storage pools are almost full.
2. Nuclear Waste Disposal • Nuclear waste disposal • Problem of nuclear waste disposal; radioactivity. • Low level wastes: • Material used to handle the highly radioactive parts of nuclear reactors . • Water pipes and radiation suits. • Lose their radioactivity after 10 to 50 years. • High level wastes (spent fuel): • Includes uranium, plutonium, and other highly radioactive elements made during fission. • Nuclear wastes have a half-life about of 10,000 to 20,000 years. • Requirements of long-term storage in a geologically stable area. • Long Term Geological Storage site at Yucca Mountain.
2. Nuclear Waste Disposal • Permanent disposal • About 95% of all radioactive waste comes from civilian source uses of nuclear energy. • More than 50 years of experience using atomic energy. • Lack any safe, permanent means for disposing its waste. • Spent fuel is stored at more than 60 nuclear power plants across the country. • By 2000, 40,000 metric tons of spent fuel have been produced. • Isolate high-level radioactive waste for thousands of years. • Safe for 10,000 years. • The primary problem has to do with the radioactive half-life of nuclear fuels. • A trans-generational issue into the realm of geologic time.
2. Nuclear Waste Disposal • Geologic burial • Hollowing out a repository a quarter mile or so below the surface • Drill holes in the host rock. • Place wastes in specially designed containers. • Place the containers in the holes in the rock. • Surround the containers with an impermeable material such as clay to retard groundwater penetration. • Seal the containers with cement. • When the repository is full, seal off the entrance at the surface. • Mark it with an everlasting signpost warning future generations of its deadly contents.
2. Nuclear Waste Disposal • Problems • Groundwater motion. • Groundwater seeps into the containers absorb the radioactive materials. • Water tables shift over time so that today's situation can change dramatically long before the radioactivity has ceased. • Tectonic activity. • Can alter the geologic base within which the repository site is situated. • Threaten the encasements of the radioactive materials. • Terrorism. • Unpredictable outcome but a very real threat in many countries.