Download
1 / 7
70 likes | 107 Views
Learn to interpret scatter diagrams, distinguish linear & nonlinear relations, and find the line of best fit using a graphing utility. Understand the terms relation, dependent & independent variables to analyze data efficiently.

E N D
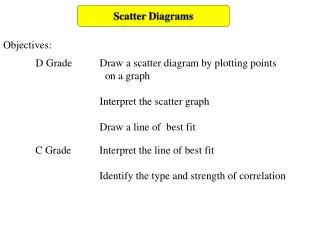
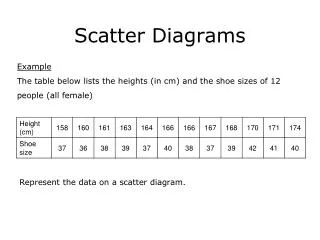
Scatter Diagrams Objective: Draw and interpret scatter diagrams. Distinguish between linear and nonlinear relations. Use a graphing utility to find the line of best fit.
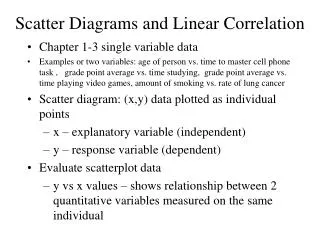
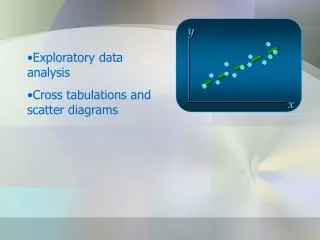
Terms • Relation • Correspondence between two sets • Dependent variable : y the value of y is determined by the value of x • Independent variable : x • Scatter diagram Plot the ordered pairs using rectangular coordinates.
Linear data • To determine if data is linear • Graph the data • Does the data have a general pattern of increasing or decreasing? • Look on page 201: can you see the “linear” pattern in those graphs stated as being linear? Do you see that those marked “nonlinear” do not have this pattern?
Finding a Linear Regression (Line of Best Fit) • Graph the data • Draw a line through the data • Identify two points on the line drawn through the data. (These points may or may not be data points.) • Find the equation of the line using the points selected. • Find slope • Find y-intercept • Write equation
Using a calculator • Go to STAT mode • Select EDIT • Clear old data • Input new data • Quit • Go back to STAT mode • Select CALC • Select LinR • The calculator will give you the slope and y-intercept. Use these values to write the equation.
Know your calculator • a: slope or y-intercept depending on the calculator • b: slope or y-intercept depending on the calculator • corr: value showing how well the equation describes the data -1: perfect linear pattern going down 1: perfect linear pattern going up 0: no linear pattern Closer the “correlation coefficient” is to -1 or 1 the better the fit of the line. • n: number of data values inputted into calculator
Assignment • Page 204 • #5, 7, 9, 13, 15, 17, 19