Download
1 / 12
120 likes | 271 Views
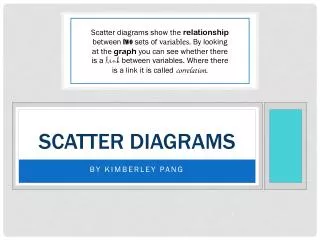
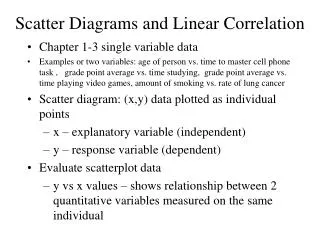
2.6 Scatter Diagrams. Scatter Diagrams. A relation is a correspondence between two sets. X is the independent variable Y is the dependent variable. The purpose of a scatter diagram is to show the type of relationship, or correlation that exists between two sets of data. Correlation.

E N D
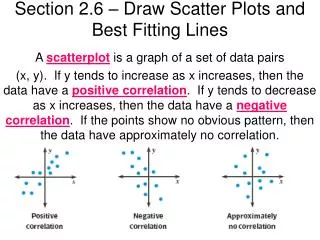
Scatter Diagrams A relation is a correspondence between two sets X is the independent variable Y is the dependent variable The purpose of a scatter diagram is to show the type of relationship, or correlation that exists between two sets of data.
Correlation A positive correlation means that as the value of one set of data increases, the other data will also increase. A negative correlation means that as the value of one set of data increases, the other data will decrease.
Direct Variation Let x and y denote 2 quantities. Then y varies directly with x, or y is directly proportional to x, if there is a nonzero number k such that y = kx The number k is called the constant of proportionality.
Inverse Variation Let x and y denote 2 quantities. Then y varies inversely with x, or y is inversely proportional to x, if there is a nonzero number k such that y = k / x
Joint Variation andCombined Variation When a variable quantity Q is proportional to the product of 2 or more other variables, we say that Q varies jointly with these quantities. Combinations of direct and / or inverse variation may occur. This is referred to as combined variation.
Write a general formula to describe each variation • a varies directly with b; a = 24 when b = 6 • m varies inversely with n squared; m = 2 and n = 3 • z varies jointly with w and the square root of b; z = 18, w = 4, and b = 9 • m varies directly with the square of b and inversely with the cube root of a; m = 4, b = 3, and a = 27
Solving Variation Problems Express the variation algebraically Use k for the constant of variation Find k from the given information Write the specific formula for the variation Solve for the required unknown in the problem
Write a general formula and solve each variation problem Hooke’s Law for an elastic spring states that the distance a spring stretches varies directly as the force applied. If a force of 12 pounds stretches a certain spring 8 inches, how much will a force of 30 pounds stretch the string?
Write a general formula and solve each variation problem The illumination produced by a light source varies inversely as the square of the distance from the source. The illumination of a light source at 5 meters is 70 candela. What is the illumination 12 meters from the source?
Write a general formula and solve each variation problem The weight of an object on Earth is directly proportional to the weight of that same object on the moon. A 200 pound astronaut would weigh 32 pounds on the moon. How much would a 50 pound dog weigh on the moon?