Download
1 / 37
370 likes | 388 Views
Learn about the economic and safety advantages of enhanced weather prediction using Lidar winds on a societal level. Discover how detailed wind forecasts improve various sectors from agriculture to energy, shaping a more secure and prosperous society.

E N D
Societal Benefits of Winds Mission Ken Miller Mitretek Systems February 8, 2007
National Research Council Vision Statement 1 “A healthy, secure, prosperous and sustainable society for all people on Earth” “Understanding the … planet …, how it supports life, and how human activities affect its ability to do so … is one of the greatest intellectual challenges facing humanity...” NRC (April 2005)
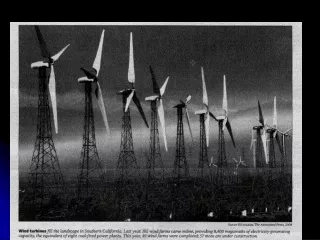
Societal Benefits from Improved Weather Forecasts Using Lidar Winds CivilianMilitary Hurricane Track Forecast Ground, air & sea operations Agriculture Weapons Delivery Transportation Satellite launch Energy Aerial Refueling Homeland Security Dispersion Forecasts for Air Quality Forecast Nuclear, Biological, Recreation & Chemical Release Science Climate Change Issues Circulation H20, trace gases, aerosol, heat transport Carbon cycle Energy cycle ImprovedOperational Weather Forecasts
Quantifiable Economic Benefits • Recent estimates for Decadal Survey, ESTO study, Lidar Winds white paper • Based on 1995, 1998 estimates (Cordes)2,3 • Key assumptions • Seem conservative • Hard to validate • Purpose • Update estimates • Added a benefit area • Increased from $228 M to $807 M / yr • Compared with estimates from other programs
Findings • Benefits greater than in 1995 • Fuel costs • Coastal population • Property values • GDP growth • Inflation • Added offshore drilling rig benefits • Magnitudes in line with other case studies • Additional benefits could be included • Recommend more study of assumptions
US Economy Affected by Weather • 2005 GDP ~ $12.5 Trillion • Percent of GDP affected by weather17 • Nearly 30% directly or indirectly ($3.75 Trillion) • About 10% directly ($1.25 Trillion) • Mission benefits large vs. cost
Benefits Reviewed • Cordes Study2,3 • Quantified $ • Reduce hurricane over-warnings • Reduce hurricane preventable damage and business interruption • Save aviation fuel using wind in routing • General forecast improvement • Not $ - Loss of life and limb • Considine et al Study12 • Off-shore drilling rig decision optimization
Hurricanes: Loss of Life and Limb11 • Not quantified here • Before Katrina, Red Cross estimated 25K to 100K deaths in a New Orleans worst case • Death rate for hurricanes with > $1 B property damage (20 yr avg to 2005) • All 128 / yr • Excluding Katrina, Andrew 34 / yr • “…late 20th century forecasting prevents 90% of hurricane-related mortality that would occur with techniques used in the 1950s”
Hurricane Over-Warning Savings10,11 • Evacuation cost: popular estimate $1 M / mile • Regional dependence • Could exceed $50M / mile in some areas • Much less in other areas • Hurricane Floyd (1999) evacuation cost rivaled damage cost 9
Reduce Hurricane Overwarning • Statistics 1995 2 2005 11 • Typical warning 341 miles 300- 400 • Affected coast 124 miles 100 • Overwarning 217 miles 200- 300 • Benefits • Cost / mile $145 K $ 1 M • Over-warn cost / landfall $ 32 M • Reduce over-warning/landfall $ 5.4 M (17%*) $50 M (50 miles) • x 2 landfalls / yr $ 11 M100 M** • Or scale 1995 to $1M / mile $ 75 M 2005 Evacuation Avoidance: $75 to 100 M/yr * Storm climatology and simulations for global 3D winds in NWP ** Ref 11, better forecasts, not necessarily wind measurement alone
Direct Hurricane Property Damage 11 • Much not preventable • Hard to demonstrate reduction • Probably improves over time • Growth & property values increase losses • “…no discernable trend from better forecasts or more effective mitigation measures”
Direct Property Damage Savings (1995)2 • 13 yr to 1995 avg damage • Selected “typical” storms w/o Andrew = $1.2 B / yr • Assumed • 15% preventable with sufficient warning • 17% forecast improvement with winds vs. 1995 24 hr • Total 15% x 17% = 2.5% • Reduction, typical hurricanes = $30 M / yr
Update Direct Damage • For > $B storms • 20 yr avg to 2005 (2005 $) • About 1 landfall / yr > $1B • $7.1 B / yr less Andrew, Katrina • $15.7 B / yr counting Andrew, Katrina
Update Direct Damage (concluded) • Using the lower number • $7.1 B / yr without Andrew, Katrina • Account for lesser hurricanes 22 • Divide by .83 • Total = $8.5 B / yr • Reduce preventable losses 2.5% 2 • 2005 Savings Estimate = $212 M / yr
Off-shore Drilling Rigs • Not in Cordes study • Gulf Rigs 12 • Need hurricane track/intensity • Optimize operating decisions: continue, evacuate, stop production • Estimated value of 24 hour forecast • Perfect $239 M / yr • Imperfect $ 10 M / yr • Assume 17% improvement2 x ($239 M-$10 M) • Benefit = $39 M / yr
General Forecasting • Winds improve accuracy and lead times • Forecasts impact the economy • How much?
General Forecasting (1995)2 • Chapman study 20 • Estimated gains from maximum forecast improvement from NWS modernization • $1.2 B / year in 1992 • Cordes2 • Assumed winds provide 5% of max • $60 M / yr ($1992)
Scale 1995 General Forecasting Estimate by GDP • 1992 • GDP = 5.6 Trillion 1992$ • Benefit was $60M • 0.0011 % of GDP • 2005 GDP estimate = $12.5 Trillion • 2005 benefit scales to > $137 M / yr
Forecast Improvements Example 1: Households • Household benefit estimates for better forecasts • $1.7 B / yr (2003) 13 • $1.87 B / yr (2005) 14 • This doesn’t include industry benefits
Forecast BenefitsExample 2: ENSO 17 • El Nino Southern Oscillation (ENSO) savings estimate • U.S. agriculture $200-300 M • U.S. corn storage $ 10- 25 M • NW US salmon fishery $ 1 M • Total $211-326 M • Can winds help?
Forecast Benefits Example 3:Est. Marginal GOES-R Benefits15 $M / yr Agriculture • Avoided irrigation costs15 41 • Orchard frost mitigation 9 Transportation • Flight delays 41 • Trucking 28 – 56 Recreational Boating 86 - 130 Energy Utilities 486 - 507 Total of Case Studies 691 - 784
Conclusions from General Forecasting Examples • Big benefits: examples = $1191 to 1428 M / yr • Is our $137 M “in the ballpark” or low? • Can add important benefits to list
U.S. Airlines Fuel Savings • User preferred routing • Critical capability for FAA Next Generation Air Transportation System (NGATS) • Wind optimal routing can save fuel • Benefits: economic, environmental, energy security
U.S. Airlines Fuel: 1995 Estimate 2 • Background • Fuel consumption effects • 50 knot wind ~ 11% fuel impact (FAA, early 1980s) • Haul extra fuel for unknown wind conditions • Real time vs. NWS forecast winds cut flight time 4.2% (simulation early 1980s) • Cordes2 lidar fuel savings estimates • 0.5% domestic • 1.0% international, less wind information available 2006 Savings = $107 M / yr (1994$)
Update U.S. Airlines Fuel • 2006 (annualized Jan - Nov data)5 • 19.3 billion gallons @ average $1.972 / gal = $38 B • 72% for domestic flight, 28% international • Estimated savings with wind data • Domestic $137 M • International $106 M 2006 US Airlines Savings Estimate= $243 M
U.S. Military Aviation Fuel for 2006 (Cordes 1998)3 Military Aviation Savings ~ $20 M (1994$)
Military Aviation – More Recent Numbers21 • AF jet fuel usage 2.6 B gallons / year • 53% over continental US • Cost • ~ $2.40 / gal • vs. $0.63 in 1995 study • Transport to plane $1.30 / gal
Military Aviation Update* * Basis is 2.6 B gallons / yr for AF, $2.40 / gal for fuel, $1.30 / gal for transport to plane, estimated Navy usage using ratio from Ref 3.
Conclusions • Dollar benefit estimates have increased • Fuel costs • Increased coastal population and property values • Growing GDP • Added offshore drilling rig benefits • Magnitudes seem in line with other weather case studies • Assumptions should be reviewed • Significant benefit areas may not be included yet
References 1. National Academy of Science, Earth Science and Applications from Space, Briefing of Decadal Survey Findings, AMS Town Hall, 1/15/07 http://www.nap.edu/catalog/11820.html 2. Cordes, J. J., “Economic Benefits and Costs of Developing and Deploying A Space-Based Wind Lidar,” GWU, NOAA Contract 43AANW400233, March 1995 3. Cordes, J. J., Memorandum to W. Baker, “Projected Benefits in Military Fuel Savings from Lidar,” June, 1998 4. Kakar, R., et al, “An Advanced Earth Science Mission Concept Study for GLOBAL WIND OBSERVING SOUNDER,” NASA HQ, December 2006. 5. Air Transport Association, Jan thru Nov 2006, average airline paid price and consumption: http://www.airlines.org/economics/energy/MonthlyJetFuel.htm 6. http://fermat.nap.edu/books/0309087155/html/9.html reference to Zeiger and Smith, 1998 7. http://www.oilendgame.com/pdfs/MediaKit/MediaWtOEg_MilFacts.pdf 8. NOAA National Climatic Data Center, www.ncdc.noaa.gov/oa/reports/billionz.html 9. WeatherZine No. 18, October 1999, http://sciencepolicy.colorado.edu/zine/archives/1-29/txt/zine18.txt 10.UCAR Quarterly, Spring 1999, http://www.ucar.edu/communications/quarterly/spring99/USWRP.html 11. H. Willoughby, E. Rappaport, F. Marks, “Hurricane forecasting, the state of the art,” Hurricane Socioeconomic Working Group, Feb 16-18, 2005, http://www.sip.ucar.edu/pdf/01_Hurricane_Forecasting_the_State_of theArt.1.pdf
References 12. T. Considine et al, “The value of hurricane forecasts to oil and gas producers in the Gulf of Mexico”, Journal of Applied Meteorology, 43, 1270-1281. http://www.isse.ucar.edu/HP_rick/energy.html 13. “The Economic Value of Current and Improved Weather Forecasts to U.S. Households”, NOAA Magazine, 2003 http://www.magazine.noaa.gov/stories/mag99.htm 14. J. Lazo, NCAR, “What are Weather Forecasts Worth?” CANSEE, October 28, 2005 15. Williamson, Hertzfeld, Cordes, “The Socio-Economic Value of Improved Weather and Climate Information”, GWU, 2002 http://www.gwu.edu/~spi/Socio-EconomicBenefitsFinalREPORT2.pdf 16. “Methodologies for the Assessment of Costs and Benefits of Meteorological Services,” http://www.wmo.ch/web/spla/R&Op-II(02)APPENDIX_D.doc 17. Weiher et al, “Valuing Weather Forecasts”, 2003 http://www.economics.noaa.gov/librarly/documents/social_science_initiative/workshop_briefing_book-ww.pdf 18. Teisberg, “Valuing Weather Forecasts: Methods, Examples, Next Steps,” http://www.economics.noaa.gov/librarly/documents/social_science_initiative/workshop_briefing_book-ww.pdf 19.”Inventory of Estimates of Value of Weather Information and References” http://www.economics.noaa.gov/librarly/documents/social_science_initiative/workshop_briefing_book-ww.pdf
References 20. R. Chapman, “Benefit-Cost analysis for the modernization and associated restructuring of the National Weather Service,” NISTIR 4867. Report to NIST, 1992 21. M. Babcock, USAF, memoranda to K. Miller, January 2007 22. R. Pielke and Landsea, “Normalized Hurricane Damages in the United States:1925-1995,” Weather and Forecasting, 13:621-631 http://www.aoml.noaa.gov/hrd/Landsea/USdmg/
Weather in Economic Decision Making 2 Simple Decision Model P = Probability of adverse weather event L = Loss from adverse weather event S = Savings by preventive action (given adverse event) C = Cost of action Cost = 0 if no adverse event Then: Expected loss without action = PL Expected loss with action = P(L-S) + C If PS > C, it is rational to act
Better Forecasts MakeBetter Decisions • P is the weather forecast (neglecting the complexities) • If less uncertainty in P • People use it more • Better economic decisions • Evacuation decisions will be conservative since loss of life is a factor