Download
1 / 26
260 likes | 434 Views
The Impact of Renewable Energy, Distributed Generation, Storage & Energy Efficiency on the Grid. Southern California Energy Summit Governor Angelina Galiteva ISO Board of Governors October 4, 2013. California ISO.

E N D
The Impact of Renewable Energy, Distributed Generation, Storage & Energy Efficiency on the Grid Southern California Energy Summit Governor Angelina Galiteva ISO Board of Governors October 4, 2013
California ISO The ISO, a nonprofit public benefit corporation, maintains the constant and reliable flow of electricity for the health, safety and welfare of consumers • 58,698 MW of power plant capacity • 50,270 MW record peak demand (July 24, 2006) • 26,500 market transactions per day • 25,627 circuit-miles of transmission lines • 30 million people served • 309 million megawatts of electricity delivered annually
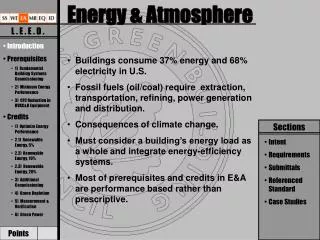
Environmental goals and policies drive the evolution to the future grid. • Electric industry faces changes: • Ambitious environmental goals • Reliability with fewer gas-fired plants • Cost containment • Need to strike a balance between reliability, renewables and reasonable cost.
California energy and environmental policies create reliability challenges • Greenhouse gas reductions to 1990 levels by 2020 • 33% of load served by renewable generation by 2020 • 12,000 MW of distributed generation by 2020 • Ban on use of once-through cooling in coastal power plants • Limits on availability of air emission credits for replacement generation
California renewable policies are succeeding. • Current installed capacity: • 3,700 MW solar (expected) • Peak 2,794 MW on Sept 18, 2013 @ 12:46 p.m. • 6,900 MW wind (expected) • Peak 4,302 MW on June 23, 2013 @ 12:22 a.m. • Expected 2020 capacity: • 10,800 MW solar • 7,900 MW wind For Operating Day Sunday, September 22, 2013 Slide 5
Significant renewable generation in ISO queue as of September 27, 2013
The future grid includes diverse resources with various operating attributes. Conventional generation electric vehicles smart homes grid scale solar wind energy storage Slide 7
To keep the system reliable, the ISO must match supply and demand instantaneously.
The ISO reacts to the instantaneous changes in electricity demand to maintain reliability. Electricity demand (load) changes over the day 34,000 9,000 Load 32,000 8,000 30,000 Load & Net Load (MW) 7,000 Wind & Solar (MW) 28,000 6,000 26,000 5,000 24,000 4,000 22,000 3,000 20,000 2,000 18,000 1,000 16,000 14,000 0 Hour
The ISO must also react to variability in wind and solar energy production. Electricity demand (load) and wind and solar output changes over the day 34,000 9,000 Load Solar 32,000 8,000 30,000 Load & Net Load (MW) 7,000 Wind & Solar (MW) 28,000 6,000 26,000 5,000 24,000 4,000 22,000 3,000 20,000 2,000 18,000 Wind 1,000 16,000 14,000 0 Hour
The ISO must manage to the net load curve by controlling resources. Net load captures variability from electricity demand and wind and solar output 34,000 9,000 Load Solar 32,000 8,000 30,000 Load & Net Load (MW) 7,000 Wind & Solar (MW) 28,000 6,000 26,000 5,000 24,000 4,000 22,000 3,000 20,000 Net Load 2,000 18,000 Wind 1,000 16,000 14,000 0 Hour
The ISO needs flexible resources to manage reliability of the future grid. One measure of flexibility is ability to change output over a short time 34,000 9,000 7,000 MW in 3-hours 32,000 6,700 MW in 3-hours 8,000 30,000 Load & Net Load (MW) 7,000 Wind & Solar (MW) 28,000 6,000 26,000 5,000 24,000 4,000 12,700 MW in 3-hours 22,000 3,000 20,000 Net Load 2,000 18,000 16,000 14,000 0 Hour
California’s success is driving the need for smarter grid applications. • Flexible generation • Non-generation capability • Demand response • Energy storage • Targeted energy efficiency • Better forecasts • Better visibility • Technology pilots • Improved regional coordination Slide 13
A diverse resource mix can meet the needs of the future grid.
California smart technology will benefit ratepayers and improve renewable integration in the West. PacifiCorp will pay the ISO for 5-minute automated balancing services. California and PacifiCorp ratepayers will benefit from automated optimization of generation dispatch. Enables higher levels of renewable integration at lower cost.
Reality of Southern California’s Grid post-San Onofre Details • San Onofre represented 16% of local generation or ~1.4 million homes • More importantly its location was on a critical transmission path that was crucial to voltage support Challenge • Once through cooling retirement timeline of 5,000 MW • Annual load growth of 400 MW • Difficult to move limited energy to load without adequate voltage support Page 16
Summary of staff approach Requirements: • Maintain reliability – Number 1 priority • Establish a common understanding Approach: • Utilize existing processes to get final decisions on long-term solutions by mid-year 2014. Solutions could include: • 50% of incremental need from energy efficiency, demand response, distributed generation, and storage. • Authorize transmission upgrades to reduce needs • Authorize conventional resources where preferred resources and transmission development is insufficient • Establish contingency plans to address key risks • Manage critical risks for air permits, transmission siting, preferred resource deployment/effectiveness, natural gas supply Page 17
San Onofre closure causes reliability problems in Southern California because Los Angeles and San Diego are load pockets with limited options • Real-time changes (“contingency” response) • System must be ready to respond to events • Some events are instantaneous; others allow 30 minutes • Real power (Watts) • Runs lights and appliances • Requires correct voltage for delivery (like pressure in water pipes) • Reactive power (Vars) • Over or under supply of Vars causes voltages to climb or fall • Local needs must be met locally • All three characteristics are needed – not all resources can provide. • Compliance with once-through cooling schedule compounds the issues. • San Onofre provided: 2,246 MW in the LA Basin • 1,100 MVars supporting voltages between Los Angeles & San Diego Page 18
Expected resource needs and potential solutions Total load in LA Basin & San Diego: 2018 = 27,500 MW 2022 = 29,000 MW • *1,800 MW authorized • May include additional preferred resources • Transmission could further reduce need Page 19
Specific near term actions (2013 - 2018) CPUC CEC ISO Page 20
Ensuring reliability 2019 & beyond CPUC • Authorize additional resources thru LTPP and other proceedings, including EE, DR, DG, storage • Direct SDG&E and SCE to pursue contingency permits in Northern San Diego County and LA Basin that will be competitively bid to independent generation developers • Address potential need for gas infrastructure in San Diego CEC • Conduct siting review of contingency generation • Establish contingency approach to OTC compliance deadlines in consultation with the State Water Resources Control Board ISO • Consider transmission alternatives - AC, DC, sub-marine cables • Monitor system upgrades in collaboration with the CEC and CPUC • Trigger contingency backups Page 21
Commitment to Preferred Resources • CPUC will seek to add 800 MW to 1000 MW of Distributed Generation, Demand Response, Efficiency, and storage on top of the 3,000 MW already targeted for the state. This commitment has several key challenges. • The additional resources will need to be geographically located • Resource mix will need to be established so that it offsets need for voltage support • Timing is critical. Page 22
The Grid of the Future • Greener, smarter and more secure electric future • Wind and solar capacity nearly doubles by year 2020 • Diverse, flexible resources key to reliability • Improved regional coordination 23
Changing usage patterns • Smart technologies help consumers manage bills • Nighttime electric vehicle charging expands • Electricity usage harder to forecast • Electric light-duty vehicles increasing • Electric mass transportation (including people movers) increasing 24
For more information go to www.caiso.com Go to flexalert.org for more information Sign up to receive Flex Alert notices via twitter or RSS feed @CalifornialSO Or download ISO Today to monitor ISO real-time power grid conditions, receive alerts and track calendar events To subscribe, simply copy and paste the link to the RSS feed you are interested in into your feed reader or news aggregator software