Download

1 / 40
400 likes | 496 Views
CPC Monthly Climate Review May 2013 Wanqiu Wang. Outline. ENSO and associated tropical fields Global anomalies Tropical MJO and cyclones CPC Forecast verification ENSO forecast. ENSO and associated fields. CPC Climate Diagnostics Bulletin. Equatorial temperature anomalies (K).

E N D
CPC Monthly Climate Review May 2013 Wanqiu Wang
Outline • ENSO and associated tropical fields • Global anomalies • Tropical MJO and cyclones • CPC Forecast verification • ENSO forecast
CPC Climate Diagnostics Bulletin Equatorial temperature anomalies (K) Feb 2013 Apr 2013 Mar 2013 May 2013 Evolution in the E Pacific is not consistent with CPC GODAS monitoring and Nino indices.
CPC GODAS monitoring http://www.cpc.ncep.noaa.gov/products/GODAS/pent_gif/xz/movie.temp.0n.gif
CPC Ocean briefing Evolution of Pacific NINO SST Indices • All Nino indices were negative: Nino1+2=-1.4C, Nino3=-0.7C, NINO 3.4=-0.3oC. • The indices were calculated based on OISST. They may have some differences compared with those based on ERSST.v3b. Fig. P1a. Nino region indices, calculated as the area-averaged monthly mean sea surface temperature anomalies (oC) for the specified region. Data are derived from the NCEP OI SST analysis, and anomalies are departures from the 1981-2010 (bar) and last ten year (green line) means.
CPC Climate Diagnostics Bulletin SST Indices
CPC Ocean briefing NINO3.4 Heat Budget • SSTA tendency (dT/dt) in NINO3.4 region (dotted black line) was near zero in May 2013. • All the advection terms were small since mid-Jan 2013. • The thermodynamicalterm (Qq) were positive most time in May 2013. • The RHS and dT/dt had large differences during Mar-May 2013. Huang, B., Y. Xue, X. Zhang, A. Kumar, and M. J. McPhaden, 2010 : The NCEP GODAS ocean analysis of the tropical Pacific mixed layer heat budget on seasonal to interannual time scales, J. Climate., 23, 4901-4925. Qu: Zonal advection; Qv: Meridional advection; Qw: Vertical entrainment; Qzz: Vertical diffusion Qq: (Qnet - Qpen + Qcorr)/ρcph; Qnet = SW + LW + LH +SH; Qpen: SW penetration; Qcorr: Flux correction due to relaxation to OI SST
5S-5N average CPC Climate Diagnostics Bulletin
CPC Ocean briefing Global SST Anomaly (0C) and Anomaly Tendency • Negative SSTA presented in the e. Pacific. • Negative phase PDO associated SSTA pattern continued in N. Pacific. • Positive SSTA was observed in the e. Indian and w. Pacific Oceans. • Tripolar SSTA presented in N. Atlantic.
CPC Drought briefing P anomalies over the United States • High lights: • May 2013 • above normal rainfall over the North Central and Midwest caused flooding • Texas continues to be dry and May started its raining season. • For seasonal mean, the Northeast ,Texas and California had below normal rainfall
CPC Drought briefing Feb 26,2013 Drought monitor • The eastern U.S. is free from drought. • Drought continues over the Southern Plains, • the Western States are still under drought except Washington and Montana
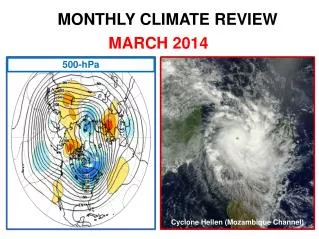
850-hPa Zonal Wind Anomalies (m s-1) Westerly anomalies (orange/red shading) represent anomalous west-to-east flow Easterly anomalies (blue shading) represent anomalous east-to-west flow Westward propagation (dashed/solid lines sloping down and to the left) of anomalies during early December were primarily due to equatorial Rossby wave activity as the MJO was then generally weak. During late December the MJO strengthened (alternating dotted/dashed lines). During March and early April, anomalies indicate signs of being influenced by equatorial Rossby wave activity with less eastward propagation evident. The MJO strengthened during early May with eastward propagation of low-level wind anomalies noted. More recently, other sub-seasonal modes have limited eastward propagation. Time Longitude CPC MJO briefing
Outgoing Longwave Radiation (OLR) Anomalies (7.5°S-7.5°N) Drier-than-normal conditions, positive OLR anomalies (yellow/red shading) Wetter-than-normal conditions, negative OLR anomalies (blue shading) (Courtesy of CAWCR Australia Bureau of Meteorology) The MJO was a dominant mode of variability across the Tropics from January into March as indicated by the alternating dashed and dotted lines. Near the end of March, the anomalies show signs of influence from other modes of tropical variability. However, MJO activity reemerged in early April across the Indian Ocean. During early May, OLR decreased significantly (stronger negative anomalies) across the Indian Ocean. The MJO signal broke down during the middle of the month and remains fairly weak, with other modes of variability influencing the pattern. Time Longitude CPC MJO briefing
OLR Anomalies – Past 30 days Drier-than-normal conditions, positive OLR anomalies (yellow/red shading) Wetter-than-normal conditions, negative OLR anomalies (blue shading) During early May, convection rapidly developed across the Indian Ocean, while the west-central Pacific experienced suppressed convection. During mid-May, the OLR field became less coherent with generally enhanced convection north of the Equator across the Indian Ocean and Maritime Continent. Convection also increased in parts of the East Pacific due to a northward displaced ITCZ Most recently in late May, the OLR field has remained incoherent with respect to the MJO. A convective dipole across the Indian Ocean and anomalous convection across Central America appear to be the dominant features. CPC MJO briefing
2013 Hurricane/Tropical Data for Southern Indian Ocean MJO event
2013 Hurricane/Tropical Data for Northern Indian Ocean Initiated by the MJO event?
May 2013 T2m Observation Original Forecast Revised Forecast HeidkeSkill Scores :non-EC: 23.90 All: 14.01 % coverage non-EC: 58.62 HeidkeSkill Scores :Non-EC: -10.38All: -4.74% coverage non-EC: 45.69
http://www.cpc.ncep.noaa.gov/products/people/mchen/CFSv2FCST/monthly/images/summaryCFSv2.NaT2m.201305.gifhttp://www.cpc.ncep.noaa.gov/products/people/mchen/CFSv2FCST/monthly/images/summaryCFSv2.NaT2m.201305.gif
May 2013 precipitation Observation Original Forecast Revised Forecast HeidkeSkill Scores :non-EC: 26.12 All: 7.54 % coverage non-EC: 28.88 HeidkeSkill Scores :Non-EC: -3.13All: -0.43 % coverage non-EC: 13.79
http://www.cpc.ncep.noaa.gov/products/people/mchen/CFSv2FCST/monthly/images/summaryCFSv2.NaT2m.201303.gifhttp://www.cpc.ncep.noaa.gov/products/people/mchen/CFSv2FCST/monthly/images/summaryCFSv2.NaT2m.201303.gif
MAM 2013 T2m MAM 2013 precipitation Observation Observation Official Forecast Official Forecast HeidkeSkill Scores :non-EC: -204.48All: -24.47% coverage non-EC: 83.62 HeidkeSkill Scores :non-EC: 58.45All: 37.28% coverage non-EC: 63.79
MAM 2013 T2m Observation Official Forecast CFSv2 from Feb 1-10, 2012 HeidkeSkill Scores :non-EC: -204.48All: -24.47% coverage non-EC: 83.62
MAM 2013 precipitation Observation Official Forecast CFSv2 from Feb1-10, 2012 HeidkeSkill Scores :non-EC: 58.45All: 37.28% coverage non-EC: 63.79
Intraseasonally filtered anomaly with respect to initial time Courtesy Mingyue Chen