Download
1 / 24
240 likes | 409 Views
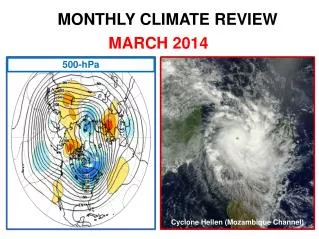
Monthly Climate Review. November 2012 Mike Charles. ENSO. Nov 2012 SST Anomalies. During the last 4-weeks, equatorial SST anomalies were +0.5ºC or above between 150ºE and 180º. SSTs were more than 0.5ºC below average in the eastern Pacific. . Evolution of Equatorial Pacific SST Anomalies.

E N D
Monthly Climate Review November 2012 Mike Charles
Nov 2012 SST Anomalies During the last 4-weeks, equatorial SST anomalies were +0.5ºC or above between 150ºE and 180º. SSTs were more than 0.5ºC below average in the eastern Pacific.
Evolution of Equatorial Pacific SST Anomalies Time Until recently, above-average SSTs have been spreading westward through most of the Pacific. Recently, above-average SSTs have persisted across much of the tropical Pacific, with below-average SSTs in the far eastern Pacific. Longitude
850mb Zonal Wind Anomalies (m/s) Westerly wind anomalies (orange/red shading). Easterly wind anomalies (blue shading). Recently, weak wind anomalies were evident across the equatorial Pacific Ocean.
Niño Region SST Departures Evolution The latest weekly SST departures are: Niño 4 0.4ºC Niño 3.4 0.2ºC Niño 3 -0.1ºC Niño 1+2 -1.4ºC
ENSO Outlook Multi-model CFS
ENSO Summary ENSO Alert System Status: Not Active • ENSO-neutral conditions continue.* • Equatorial SSTs remain above average across much of the Pacific Ocean. • The atmospheric circulation over the tropical Pacific is near average. • ENSO-neutral is favored through the Northern Hemisphere winter 2012-13.*
Global Temp and Precip Anomalies Temp Anomalies Precip Anomalies
US Temp and Precip Anomalies Past 30 Days Temp Anomaly Precip % of Normal
Outgoing Longwave Radiation (OLR) Anomalies Drier-than-normal conditions, positive OLR anomalies (yellow/red shading) Wetter-than-normal conditions, negative OLR anomalies (blue shading) (Courtesy of CAWCR Australia Bureau of Meteorology) From late May into September, eastward propagation of both enhanced and suppressed convection is evident across the eastern hemisphere (alternating dashed and dotted lines). The MJO was active during October into November with enhanced convection developing over Africa during mid-October and shifting eastward to the western Pacific by mid-November. The recent convection near 160oE is due, at least in part, to a strong equatorial Rossby (ER) wave while enhanced convection near 80oE is most likely a superposition of a ER wave and eastward moving Kelvin wave.
200mb Velocity Potential Anomalies Positive anomalies (brown shading) indicate unfavorable conditions for precipitation Negative anomalies (green shading) indicate favorable conditions for precipitation Eastward propagation was evident from late May into September associated with the MJO (alternating dashed and dotted lines), as well as atmospheric Kelvin wave activity, which at times resulted in fast eastward propagation of observed anomalies. In mid-September, anomalies decreased and eastward propagation became less clear. In early October, upper-level divergence (convergence) increased over the Pacific (Indian Ocean) and has shifted eastward throughout October and early November. Anomalies decreased from mid to late November and propagation became less clear.
MJO Index – Recent Evolution • The axes (RMM1 and RMM2) represent daily values of the principal components from the two leading modes • The triangular areas indicate the location of the enhanced phase of the MJO • Counter-clockwise motion is indicative of eastward propagation. Large dot most recent observation. • Distance from the origin is proportional to MJO strength • Line colors distinguish different months The MJO index has increased in amplitude during the past week, but the apparent strengthening is most likely due to both equatorial Rossby wave and atmospheric Kelvin wave activity.
Ensemble GFS (GEFS) MJO Forecast RMM1 and RMM2 values for the most recent 40 days and forecasts from the ensemble Global Forecast System (GEFS) for the next 15 days light gray shading: 90% of forecasts dark gray shading: 50% of forecasts Yellow Lines – 20 Individual Members Green Line – Ensemble Mean The bias-corrected ensemble GFS forecasts propagation through Phase 3 during Week-1 with a weakening in the signal during Week-2.
6-10day Verification ManualCDC NAEFSAuto Temp Temp ManualCDC NAEFSAuto Precip Precip
8-14day Verification Temp Temp Temp Precip Precip
Monthly Verification Temp Official Official Revised Revised Obs Obs Non-Equal Chance(non EC) forecasts: 75.27 All forecasts: 29.53 % coverage not Equal Chance forecasts : 39.22 Non-Equal Chance(non EC) forecasts: 75.74 All forecasts: 44.40 % coverage not Equal Chance forecasts : 58.62 Precip Non-Equal Chance(non EC) forecasts: 30.23 All forecasts: 5.60 % coverage not Equal Chance forecasts : 18.53 Non-Equal Chance(non EC) forecasts: 25.00 All forecasts: 11.21 % coverage not Equal Chance forecasts : 44.83
Seasonal Verification Temp Fcst Obs Non-Equal Chance(non EC) forecasts: 3.89 All forecasts: 2.80 % coverage not Equal Chance forecasts : 71.98 Precip Fcst Obs Non-Equal Chance(non EC) forecasts: -40.22 All forecasts: -7.97 % coverage not Equal Chance forecasts : 19.83
2012 Atlantic Hurricane Season Tied with 1887, 1995, 2010, and 2011 as the third most active year in recorded history
CPC's Official Hurricane Forecast OBS 19 10 1