Download

1 / 44
440 likes | 576 Views
July 2013 Monthly Climate Review. Qin Ginger Zhang. Appreciations: Kingtse Mo, Caihong Wen, Wei Shi, Luck He, Yunyun Liu and others . Outline. Tropical Overview: ENSO conditions MJO and Tropical Storms Global Overview U.S. Climate Forecast Verification ( Monthly/Seasonal)

E N D
July 2013Monthly Climate Review Qin Ginger Zhang Appreciations: Kingtse Mo, Caihong Wen, Wei Shi, Luck He, Yunyun Liu and others
Outline • Tropical Overview: • ENSO conditions • MJO and Tropical Storms • Global Overview • U.S. Climate • Forecast Verification (Monthly/Seasonal) • Notable events and outlooks
Ocean Briefing Evolution of Pacific NINO SST Indices • All Nino indices were negative, with Nino 3.4 = -0.3 oC • ENSO-neutral conditions continued in July 2013. • The indices were calculated based on OISST. They may have some differences compared with those based on ERSST.v3b. Fig. P1a. Nino region indices, calculated as the area-averaged monthly mean sea surface temperature anomalies (oC) for the specified region. Data are derived from the NCEP OI SST analysis, and anomalies are departures from the 1981-2010 (bar) and last ten year (green line) means.
Ocean Briefing Equatorial Pacific SST (ºC), HC300 (ºC), u850 (m/s) • Below average SSTs was observed in the eastern Pacific since May 2013. • Positive HC300 anomalies in the east-central Pacific continued in July 2013. • Low-level zonal wind anomalies were near normal in July 2013.
Ocean Briefing Subsurface Temperature Anomalies along Equator BOM GODAS ECMWF S4 JMA TAO June July • Subsurface temperature distribution in the last two months exhibited large uncertainty among ocean reanalysis products ECMWF S4: http://www.ecmwf.int/products/forecasts/d/charts/oras4/reanalysis/sections/xzmaps/1m!1m!201306!Anomaly!Temperature!/ JMA :http://ds.data.jma.go.jp/tcc/tcc/products/elnino/outlook.html BOM:http://www.bom.gov.au/climate/enso/e
Ocean Briefing TAO GODAS - TAO Equatorial Pacific Temperature Anomaly • The TAO data showed a warming in the far eastern Pacific in late July 2013, which seems be associated with an eastward propagation of the warm anomalies from the central Pacific. • However, there were large uncertainties in subsurface temperature anomalies : discrepancies between GODAS and TAO temperature anomalies were as large as 2 degree in the past three pentads. • The TAO/TRITON array has encountered significant outages since summer 2012, particularly in the eastern part of the array. Source: Michael Mcphaden PMEL
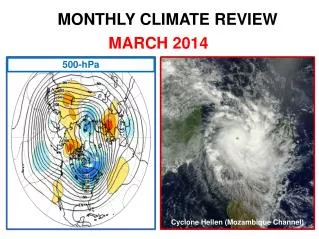
200-hPa Velocity Potential Anomalies (5°S-5°N) Positive anomalies (brown shading) indicate unfavorable conditions for precipitation Negative anomalies (green shading) indicate favorable conditions for precipitation A MJO signal is evident in late February and early March. Anomalies increased in magnitude with more robust eastward propagation indicated during April 2013. The velocity potential anomalies were more coherent only briefly during early to mid-May. During late June and the first half of July, the signal was more coherent and consistent with a canonical MJO footprint. More recently, a more stationary pattern is noted. Time Longitude
OLR Anomalies – Past 30 days Drier-than-normal conditions, positive OLR anomalies (yellow/red shading) Wetter-than-normal conditions, negative OLR anomalies (blue shading) During early to mid-July, the MJO enhanced phase propagated over the Indian Ocean to the Maritime Continent, promoting increased convection. The MJO signal began to weakened during mid-July. Enhanced convections shifted northeast across Southeast Asia and the Maritime Continent. Enhanced (suppressed) convection continued across the North American monsoon region (central Pacific). During late July and early August, other modes of variability influenced anomalous convection with enhanced convection persisting across Southeast Asia and the Maritime Continent. Drier conditions are noted across Mexico and the Caribbean region.
MJO Index -- Recent Evolution • The axes (RMM1 and RMM2) represent daily values of the principal components from the two leading modes • The triangular areas indicate the location of the enhanced phase of the MJO • Counter-clockwise motion is indicative of eastward propagation. Large dot most recent observation. • Distance from the origin is proportional to MJO strength • Line colors distinguish different months During the previous month, the Wheeler-Hendon Index indicated a weak MJO signal.
CFSv2 MJO forecast for 30-day WH-MJO Index and 45-day Velocity Potential Anomaly
Drought Briefing Tropical storms/hurricanes Atlantic: 4 TCs Andrea, Barry, Chantal,Dorian Eastern Pacific 5 Hurricanes and 2 TCs in July Hurricanes: Barnara, Cosme, Dalila, Erick, Gil TCs: Alvin and Flossie (25-30Jul hit Hawaii)
Luck He Flossie made a brief, but eventful, pass through the Central North Pacific Ocean. Tropical Storm Flossie entered the Central Pacific Hurricane Center’s area of responsibility in the early morning hours of July 27th. It became the first storm to trigger tropical cyclone related warnings for the state of Hawaii since a previous incarnation of Flossie in 2007. Initial data suggest that the center of Flossie never made and fall, but came close on Kaua’i in the early morning hours of July 30th.
Ocean Briefing Global SST Anomaly (0C) and Anomaly Tendency • SST was near-normal across the western-central tropical Pacific and below average across the eastern Pacific. • Strong positive SST anomalies were observed in the high latitudes of North Pacific, North Atlantic, and Arctic Oceans. • A strong warming tendency was observed in the high latitudes of North Pacific, North Atlantic and Artic Oceans. Fig. G1. Sea surface temperature anomalies (top) and anomaly tendency (bottom). Data are derived from the NCEP OI SST analysis, and anomalies are departures from the 1981-2010 base period means.
Ocean Briefing Pacific Decadal Oscillation Index • Negative PDO phase since May 2010 has persisted for more than 3 years (39 months) now, and the PDO index slightly strengthened in July 2013 with PDO index = -1.5. • The apparent connection between NINO3.4 and PDO index suggest connections between tropics and extratropics. • Pacific Decadal Oscillation is defined as the 1st EOF of monthly ERSST v3b in the North Pacific for the period 1900-1993. PDO index is the standardized projection of the monthly SST anomalies onto the 1st EOF pattern. • The PDO index differs slightly from that of JISAO, which uses a blend of UKMET and OIv1 and OIv2 SST.
North Pacific & Arctic Ocean: SST Anom., SST Anom. Tendency, OLR, SLP, Sfc Rad, SfcFlx • Large positive SSTA were observed in the North Pacific and Artic Oceans. • Large positive SW+LW anomalies were observed in the Artic Ocean and the high latitudes of North Pacific, leading to significant warming in these regions. Fig. NP1. Sea surface temperature (SST) anomalies (top-left), anomaly tendency (top-right), Outgoing Long-wave Radiation (OLR) anomalies (middle-left), sea surface pressure anomalies (middle-right), sum of net surface short- and long-wave radiation anomalies (bottom-left), sum of latent and sensible heat flux anomalies (bottom-right). SST are derived from the NCEP OI SST analysis, OLR from the NOAA 18 AVHRR IR window channel measurements by NESDIS, sea surface pressure and surface radiation and heat fluxes from the NCEP CDAS. Anomalies are departures from the 1981-2010 base period means.
NAO and SST Anomaly in North Atlantic • High-latitude North Atlantic SSTA is generally closely related to NAO index (negative NAO leads to SST warming and positive NAO leads to SST cooling). • NAO continued to be positive in July 2013. • In the past three hurricane seasons, positive SSTA in MDR was strong in 2010, and became weakening in subsequent two years. Fig. NA2. Monthly standardized NAO index (top) derived from monthly standardized 500-mb height anomalies obtained from the NCEP CDAS in 20ºN-90ºN (http://www.cpc.ncep.noaa.gov). Time-Latitude section of SST anomalies averaged between 80ºW and 20ºW (bottom). SST are derived from the NCEP OI SST analysis, and anomalies are departures from the 1981-2010 base period means.
Northern American Monsoon P time series WET July Arizona New Mexico
NAM P time series (Texas) Eastern Texas Western Texas
StreamflowPercentile (USGS) • Drought improved over the Great Plains and California, Texas. • Above normal rain caused flooding over the Southeast and the Northeast. • Good monsoon rainfall over the Southwest improved drought conditions over AZ and western NM
Drought Briefing Drought monitor • The pattern is similar to the DM last month but the intensity decreases • the Western States are still under drought except Washington and Montana
July Temperature Forecast Verification Observations Original Forecast Revised Forecast Non-EC Skill Score: 25.63; non-EC coverage: 51.29% All Forecasts: 13.15 Non-EC Skill Score: 60.13; non-EC coverage: 34.05% All Forecasts: 20.47
July Precipitation Forecast Verification Observations Original Forecast Revised Forecast Non-EC Skill Score: 57.55; non-EC coverage: 22.84% All Forecasts: 13.15 Non-EC Skill Score: 75.41; non-EC coverage: 26.29% All Forecasts: 19.83
MJJ Temperature Forecast Verification Observations Official Forecast Non-EC Skill Score: 0.60; non-EC coverage: 71.55% All Forecasts: 0.43
MJJ Precipitation Forecast Verification Observations Official Forecast Non-EC Skill Score: 30.77; non-EC coverage: 28.02% All Forecasts: 8.62
Status of 2013 Asian Summer Monsoon The July anomalous rainfall pattern over monsoon Asia is very similar to June pattern. Central and Northern India continues to receive above normal monsoon rainfall, even though east central India is deficient.
Hot and Dry in Southeastern China Precipitation Percentile of July 2013 Having 19 days in July, the maxima temperature was higher than 100 ºF in Shanghai, China Temperature Anomalies in July 2013