Download
1 / 40
400 likes | 575 Views
CPC Monthly Climate Review December 2013 (Jin Huang). Outline: 0. January 2014 Cold air outbreak Global Patterns (ENSO, PDO,MJO, AO/NAO) Global and US anomalies Forecasts, and verification Thoughts on CPC Monthly Climate Reviews.

E N D
CPC Monthly Climate ReviewDecember 2013(Jin Huang) Outline: 0. January 2014 Cold air outbreak Global Patterns (ENSO, PDO,MJO, AO/NAO) Global and US anomalies Forecasts, and verification Thoughts on CPC Monthly Climate Reviews Thanks to Huug, Yan, Kingtse, Wanqiu, Emily, Qin, Mike Tippett and Ben for various info and CPC product, Netherland products,…
One Theory to Link Jetstream to extreme weather and to global warming (J. Francis) Arctic Amplification Poleward thickness gradient weakening Weaker upper-level, zonal-mean flow, reduced phase speed Peaks of upper-level ridges elongate northward, wave amplitude increases • Rossby waves progress more slowly • Weather conditions more persistent • Increased probability of extremes: cold spells, heat waves, flooding, prolonged snowfall, and drought
1. December 2013 Global Patterns • ENSO • PDO • MJO • AO/NAO
Recent Evolution of Equatorial Pacific SST Departures (oC) ENSO Neutral Time During May-September 2013, below-average SSTs were observed over the eastern half of the Pacific. Recently, SSTs have been near-average across much of the equatorial Pacific. Longitude
Global SST Anomaly (0C) and Anomaly Tendency • SST was near-normal in the central-eastern tropical Pacific. • Positive SST anomalies presented north of Japan, across the N. Pacific, and in the western equatorial Pacific. • Negative SST anomalies presented in southeast Pacific. • A warming tendency presented north of Japan and eastern N. Pacific, east of Philippe. • A cooling tendency was observed along the Gulf Stream and subpolar Arctic.
IRI/CPC NINO3.4 Forecast Plume • Most of the models predicted ENSO-neutral would continue into the Northern Hemisphere summer 2014. • The consensus forecast favors ENSO-neutral conditions in the next spring and summer 2014.
SST Outlook: NCEP CFS.v2 Forecast Issued 6 January 2014 The CFS.v2 ensemble mean (black dashed line) predicts ENSO-neutral through the N.H. spring 2014 followed by El Niño during summer 2014.
Time Magazine predicts: El Niño IsOnItsWay When the Pacific Ocean warms in 2014, the weather will get weird 2014 could be the hottest year on record. ByBryanWalsh Jan. 13, 2014
Pacific Decadal Oscillation Index • Negative PDO phase since May 2010 has persisted for 43 months now, and the negative PDO index persisted in Dec 2013. • The apparent connection between NINO3.4 and PDO index suggest connections between tropics and extratropics. • However, the negative phase of PDO since Jun 2012 seems not closely connected with the Nino3.4 SSTA.
850-hPa Zonal Wind Anomalies (m s-1) Westerly anomalies (orange/red shading) represent anomalous west-to-east flow Easterly anomalies (blue shading) represent anomalous east-to-west flow During late July through mid-August, the MJO was weak. In late August and early September, westerly (easterly) anomalies increased over the eastern (western) Pacific in associated with renewed MJO activity. During October, equatorial Rossby wave activity was strong from 160E to 100E as westward movement features are evident (red box). MJO activity was less coherent during this period. During November and December, easterly anomalies were persistent from 120E to near the Date Line. Westerly anomalies were also evident across the Indian Ocean during this period. These anomalies have decreased some during late December. Time Longitude
OLR Anomalies – Past 30 days During early to mid-December, enhanced convection persisted across the Indian Ocean, while suppressed convection continued over much of the equatorial western and central Pacific. During mid to late December, enhanced convection shifted east to the Maritime Continent with suppressed convection persisting at the Date Line. Enhanced convection intensified across Brazil with suppressed convection indicated over parts of south-central South America. By early January, enhanced convection persisted across parts of the Indian ocean and western Pacific and increased in coverage over parts of central and southern Africa.
200-hPa Velocity Potential Anomalies (5°S-5°N) The MJO was active (alternating dashed and dotted lines) during June and early July before weakening at the end of the month. The MJO was not active during late July and much of August, but strengthened during late August and September, with eastward propagation of robust upper-level velocity potential anomalies. Other modes of tropical intraseasonal variability are also evident. From late October to early December, the MJO was not very strong or coherent. There was evidence of coherent eastward propagation at times during this period, but much of this activity exhibited fast propagation speeds more consistent with atmospheric Kelvin waves. A slower eastward propagation of 200-hPa velocity potential anomalies was observed during mid-December. Time Longitude
2. US and Global Anomalies • P, T, H500mb, • Snow, sea ice, ozone • Drought; Flooding
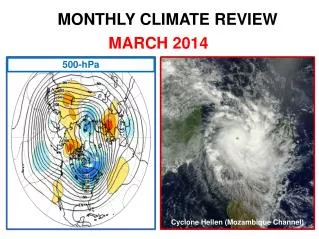
500mb Height Anomaly Nov 2013 Dec. 2013
Sea ice, Snow Anomaly (Dec.13) Snow cover Sea Ice concentration
Ozone Anomaly (Dec) NH SH
December (and early Jan) Temperature and Precipitation Temperature Precipitation Monthly Mean Anomaly
Drought Monitor • Drought conditions over California and Nevada , western Texas
SM Percentiles Both show dryness from California to Oregon , North Central (EMC) , Wetness over eastern Missouri and Dakotas The UW also shows wetness over the East EMC Dec 2013 Multi model ensemble The UW multi model Ensemble
Streamflow Percentiles (USGS) Dry: Similar to last month except California drought was more severe Wet: wetness over Dakotas , Colorado last month improved Dryness and low flow over most California and dryness expanded to the Pacific Northwest More recent situation
Enhanced Convection over the western Pacific centered at 120E Suppressed convection over the Central Pacific This pattern also has been persistent for nearly 2-3 months Not favorable for rain over California A PNA type of pattern with positive anomalies along the West Coast
Correlation bw NPSST and P sst: ersst P: U. Washington P analysis 0.5 degrees Period 1915-2010 for JFM To be statistically significant at the 5% level, the magnitude of correlations need to be greater than 0.2 It shows positive npsst=> dryness over California, the Southwest and Florida wetness over the Ohio Valley
Detecting Flooding (“Haiyan” Typhoon, Nov, 2013) by Global Flood Monitoring System (GFMS)/DRIVE model Flood detection [mm] 1-day rain [mm] 3-hour rain [mm/h]
Western Indonesia Flooding Short term precipitation and flood forecast on Jan 2, 2014 X Streamflow [m3/s] at Lat: -1.3 Lon: 104.1 This system could be useful for 3-7 Day Hazard Outlook NWP precipitation For future 4~5 days Satellite precipitation
3. Forecast and Verifications • NMME Forecasts • NMME skill assessment and real-time verification • CFSv2 forecast for Dec. severe weather
NMME SST Forecasts Feb 2014 FMA 2014
NMME T and P Forecasts T2M Feb Precip Feb T2M FMA Precip FMA
T2m RMSE: 20N-20S CFSv2 Has Larger RMSE 64% of the Time Single Model NMME September Starts 0.5-5.5 Lead Times
The winner various with variables, seasons, lead time etc. NMME is always among the best.
NMME Real-Time Verifications: T2m OND 2013 CFSv2 CMC1 CMC2 Temperature Precipitation GFDL NCAR NASA NMME ProbFcst Obs
CFS-based Extended-range Hazard Guidance:Mississippi & Ohio Valleys Severe Thunderstorm Outbreak, December 21-22, 2013 As early as 11 days prior, identifiably consistent CFS forecasts indicated environments favorable to severe weather.
CFSv2 14-day forecast of “tornado index” 06Z Dec 8, 2013 start, single ensemble member
4. Thoughts on CPC’s Monthly Climate Reviews • Purpose of CPC Climate Reviews? • Any external audience? • Is this mainly for CPC internal training? • CPC: Climate Reviews focus on real-time monitoringand diagnosis • However, somehow duplicated with other CPC briefings • Drought briefing • Ocean briefing • Seasonal forecast conference • NCDC: long-term monitoring; State of Climate (except ENSO) • ESRL: Attributions of past major events • Does CPC want to do authoritative and consistent Climate Reviews on real-time monitoring, diagnosis and verification/attribution? If so, • the reviews should be done by a few experts as CPC official products • the audience should include external people • May need to include additional near real-time forecast diagnosis and attributions , which will be helpful to CPC forecasters, general users, and forecast tool/modle diagnosis and improvements.